This the multi-page printable view of this section. Click here to print.
Cost Explorer
The amount used by period can be checked based on a Budget set by a user and Budget use notification can also be set up.
- 1: Cost analysis
- 2: Budget
1 - Cost analysis
By grouping or filtering data based on diverse conditions, you can view the desired cost data at a glance.
Verifying cost analysis
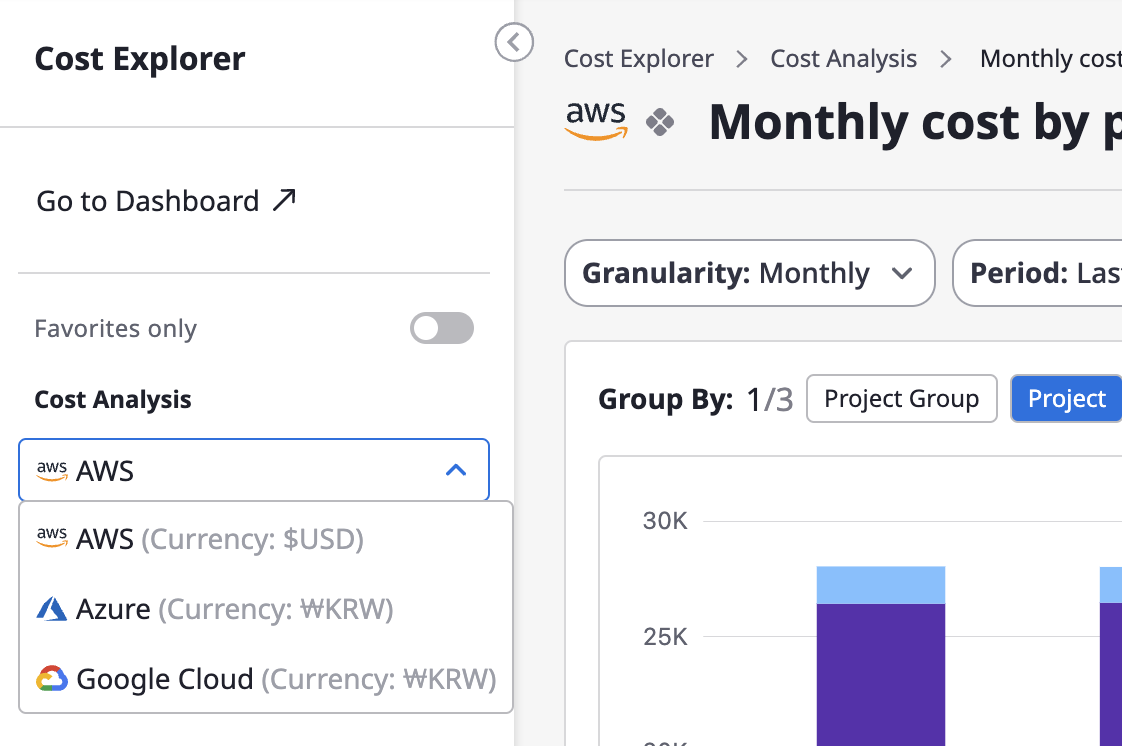
Selecting a data source
If you have more than one billing data source connected, you can perform a detailed cost analysis by selecting each data source from the "Cost Analysis" section in the left menu.
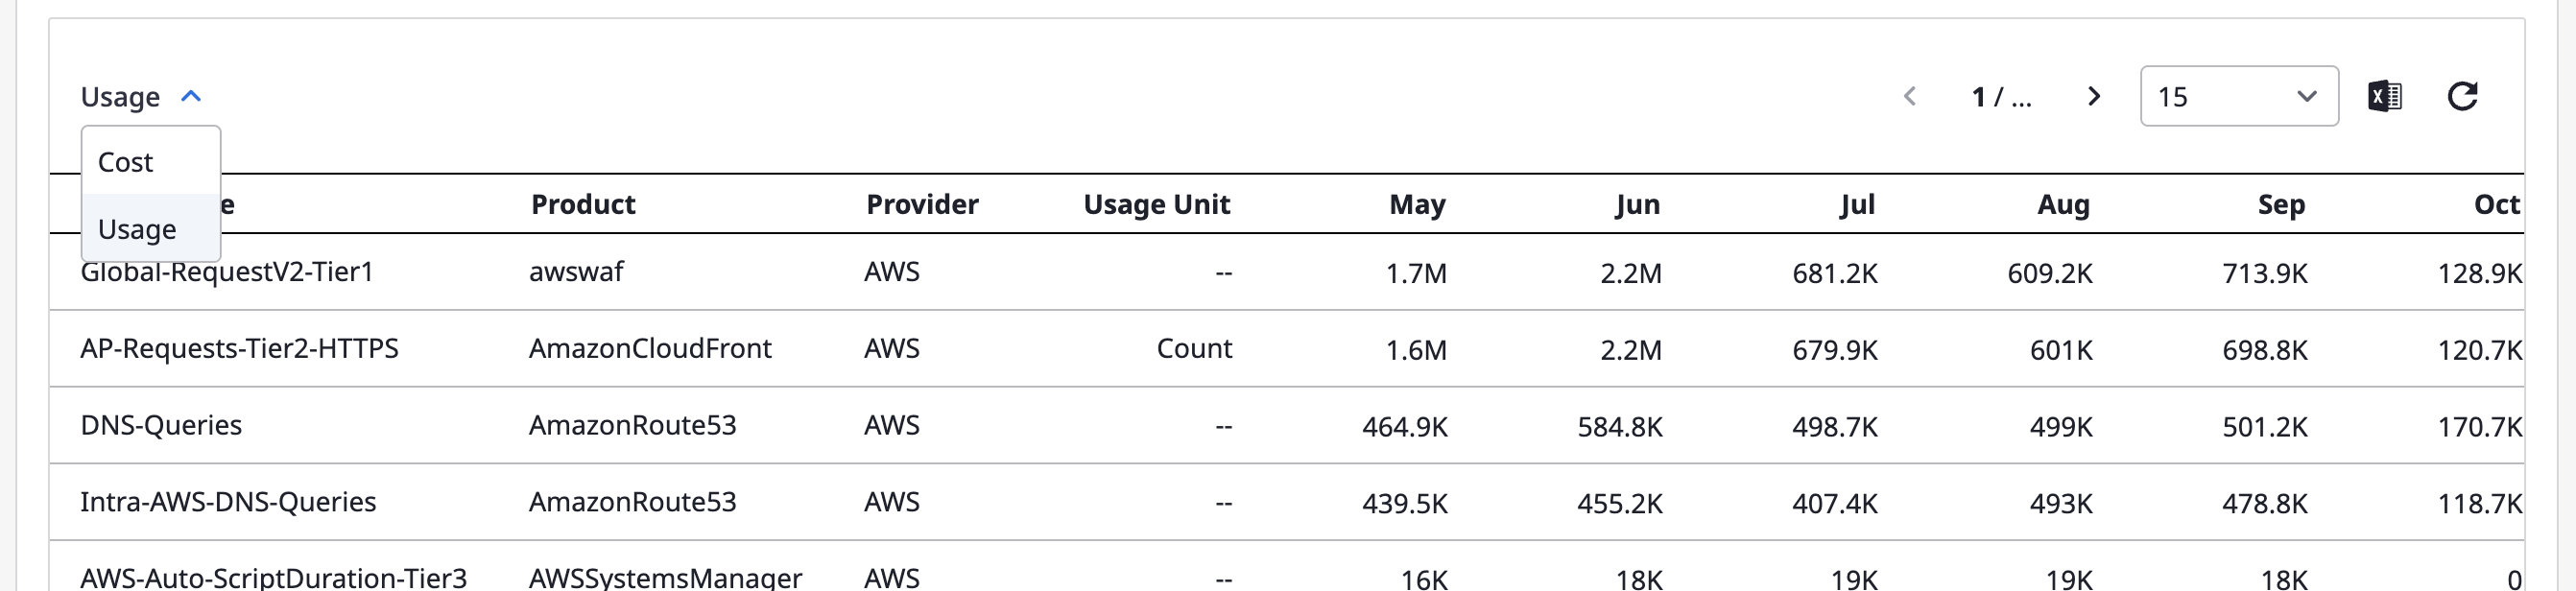
Selecting the granularity
Granularity is criteria set for how data will be displayed. The form of the provided chart or table varies depending on the detailed criteria.
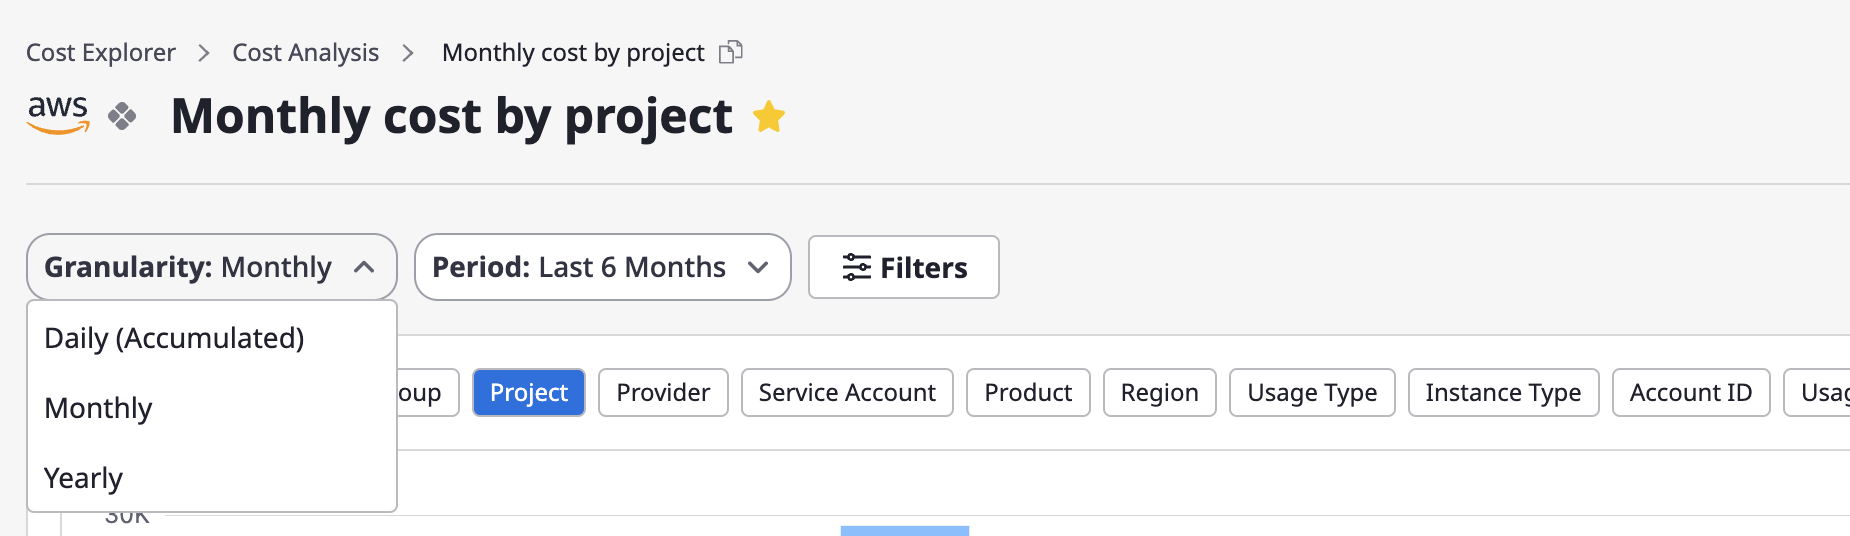
Daily: You can review daily accumulated data for a specific month.Monthly: You can check monthly data for a specific period (up to 12 months).Yearly: You can examine yearly data for the most recent three years.
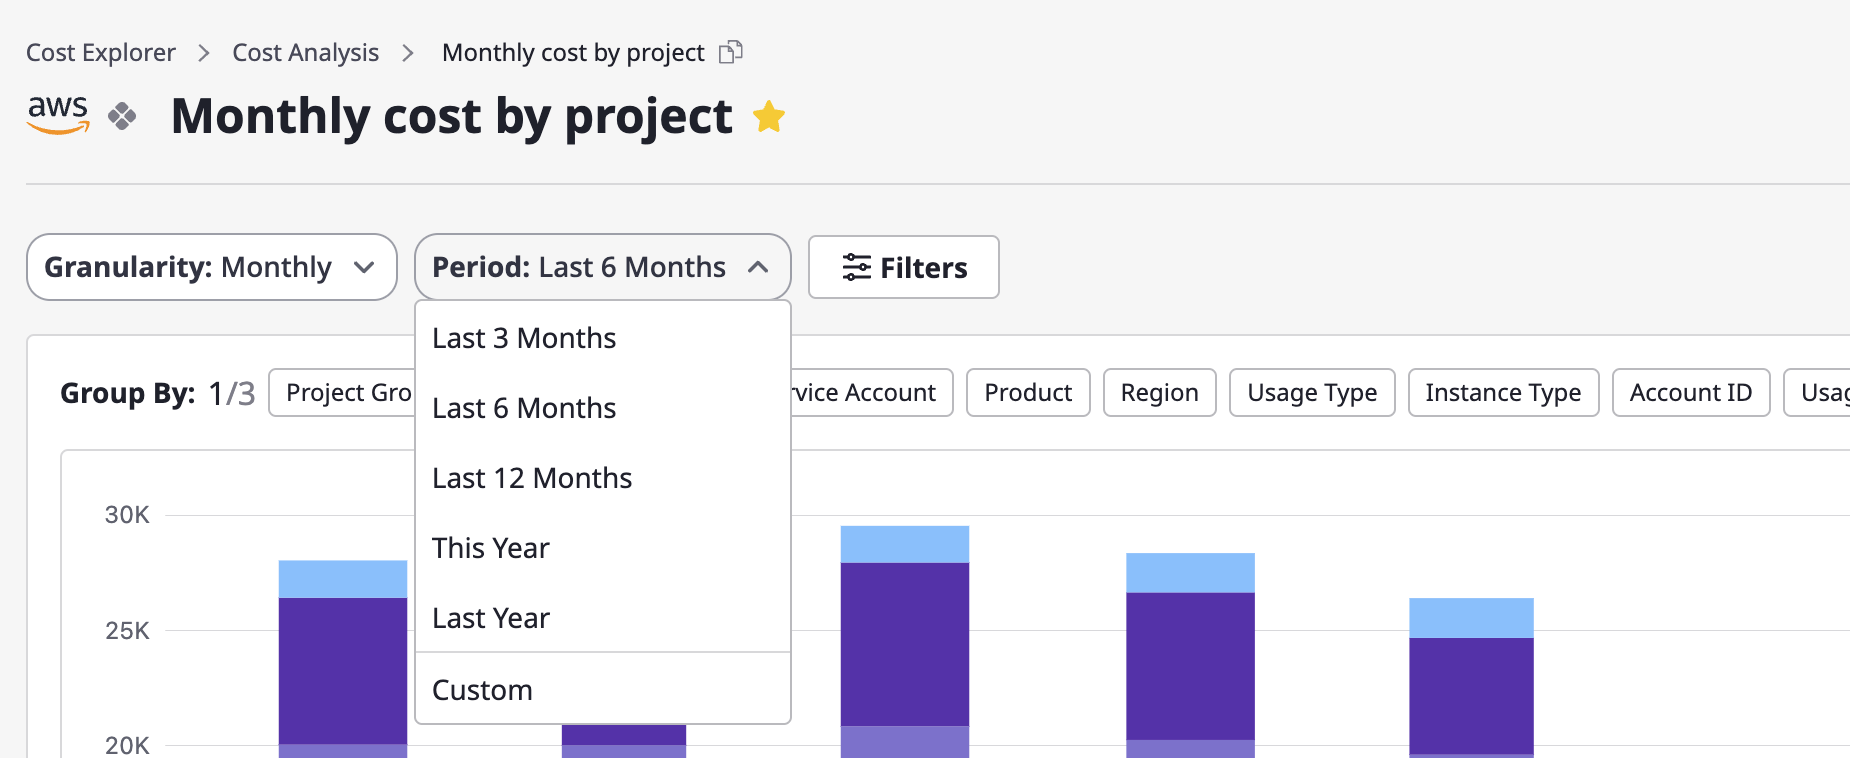
Selecting the period
The available options in the "Period" menu vary depending on a granularity you choose. You can select a menu from the [Period] dropdown or configure it directly through the "Custom" menu.
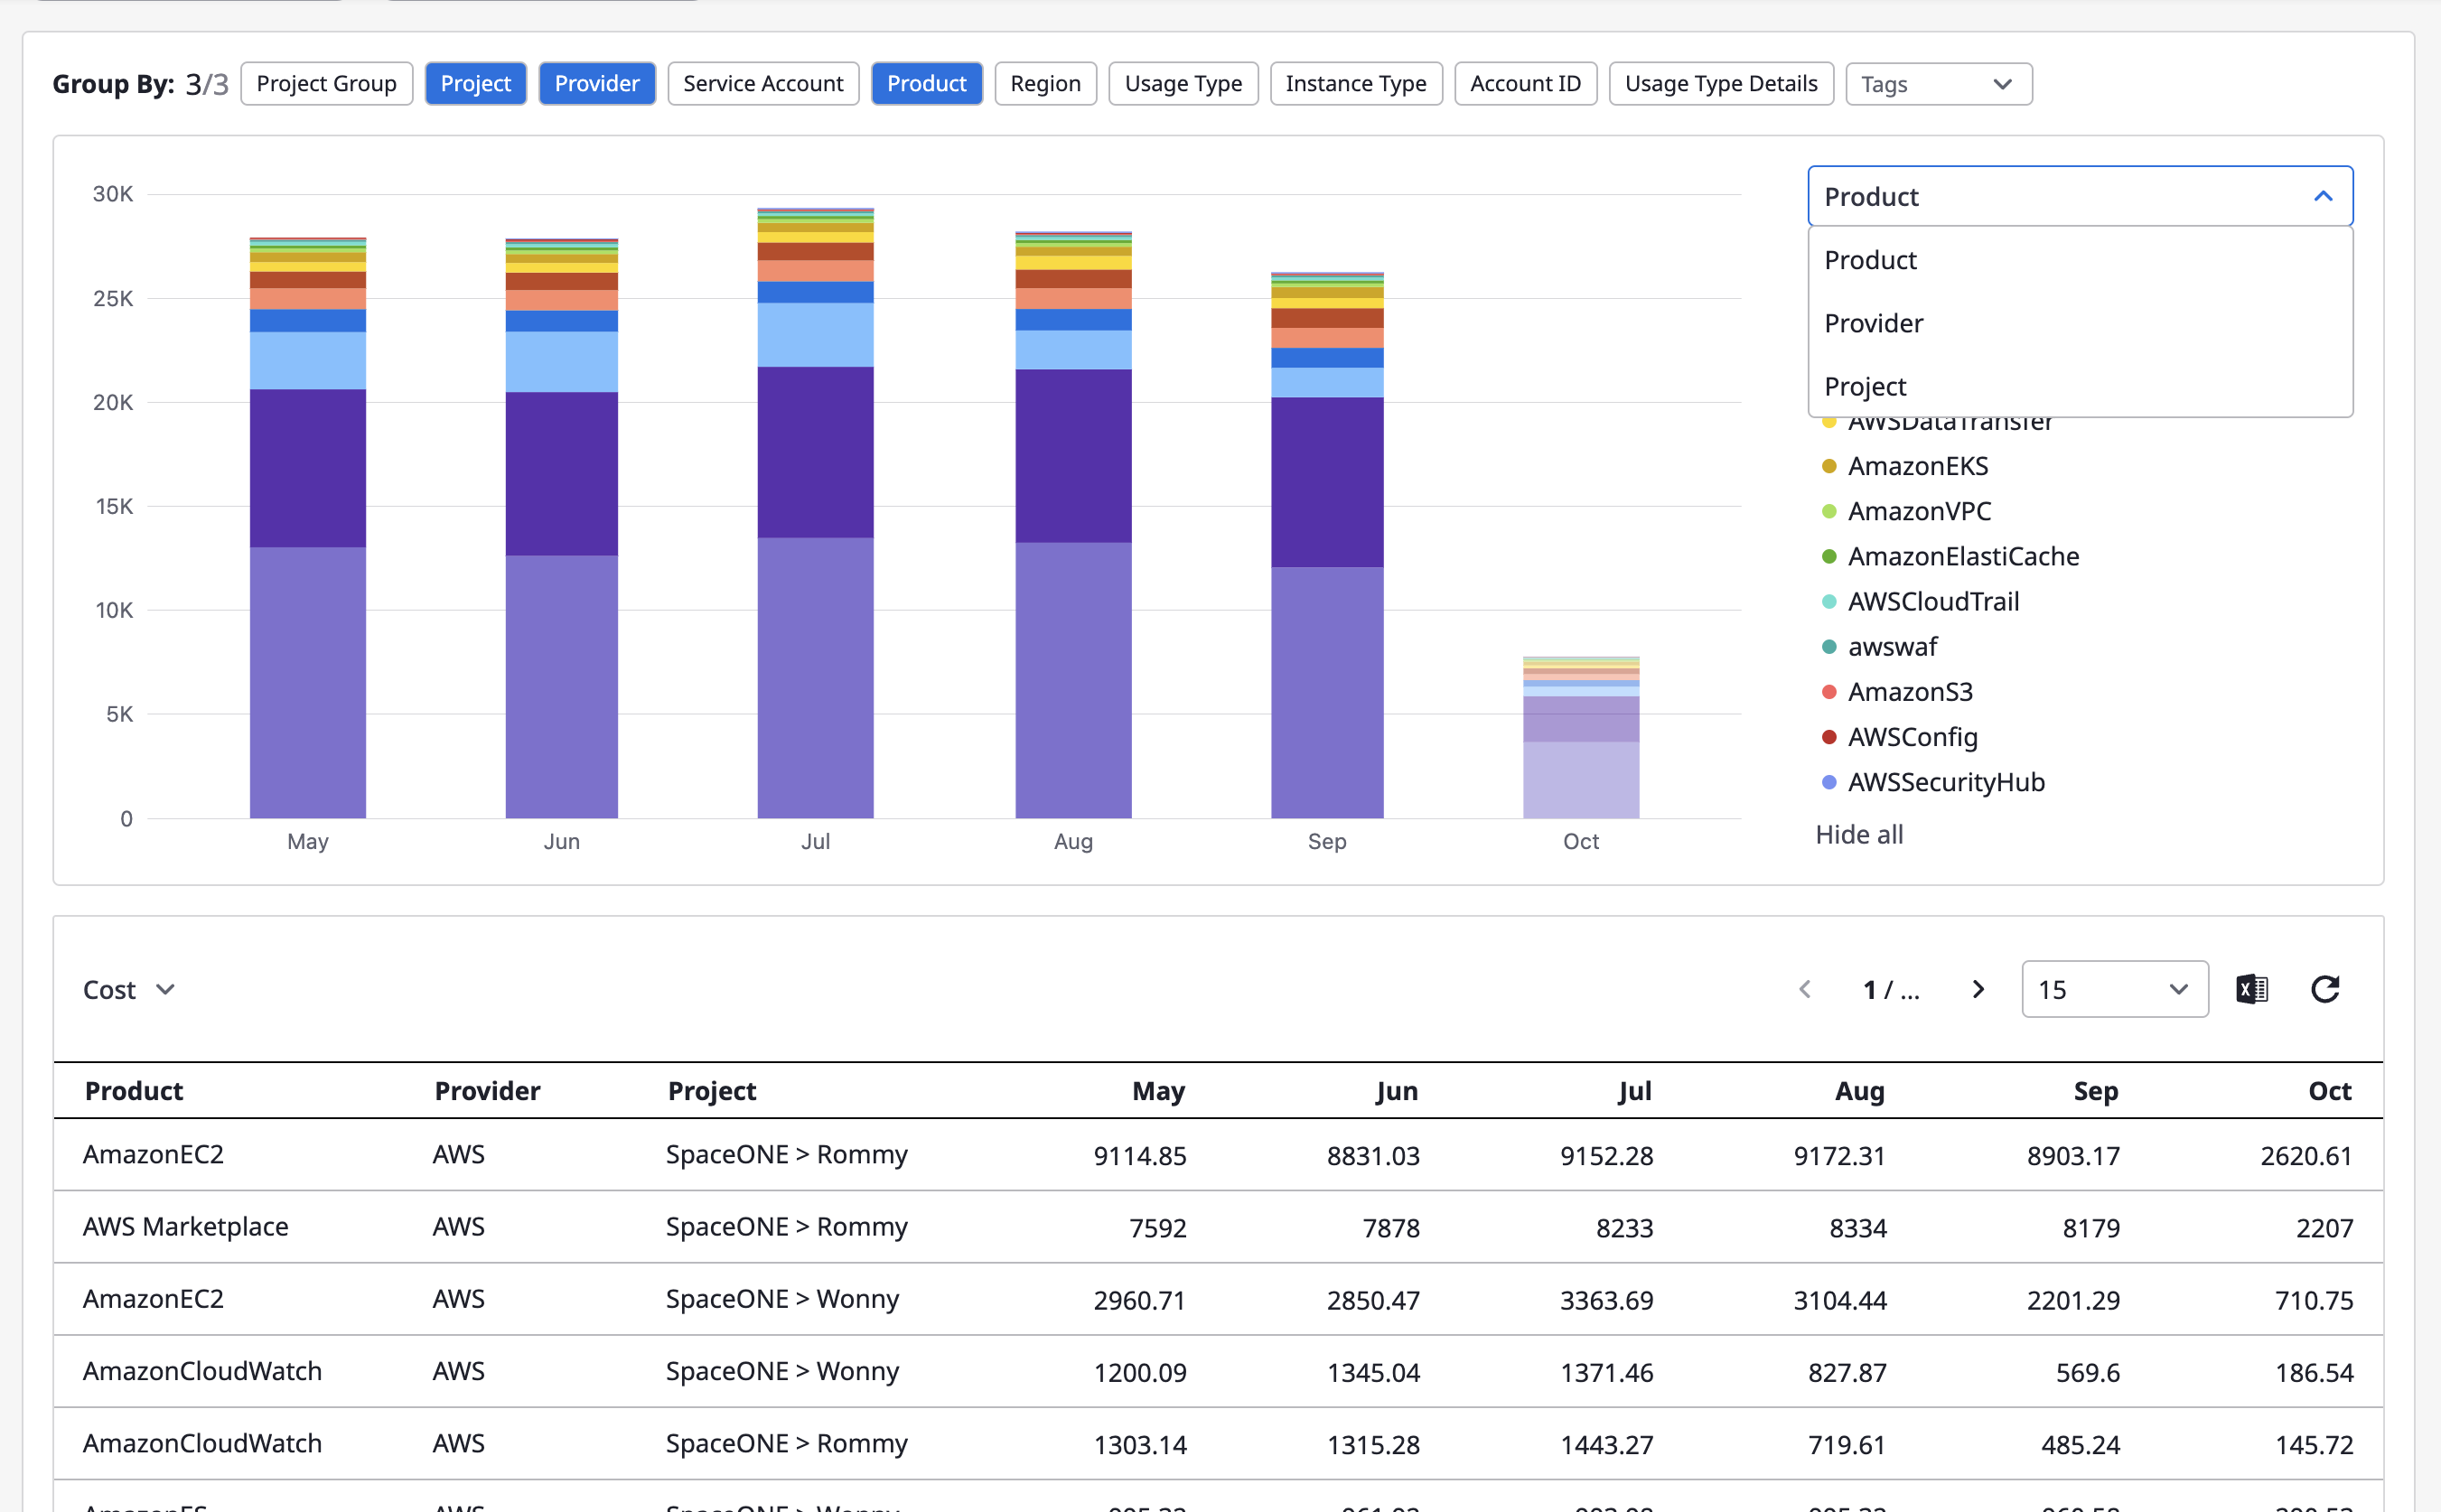
Group-by settings
You can select more than one result from group statistics. In the chart, only one selected result of group statistics is displayed, and in the table, you can see all the results from group statistics that you select.
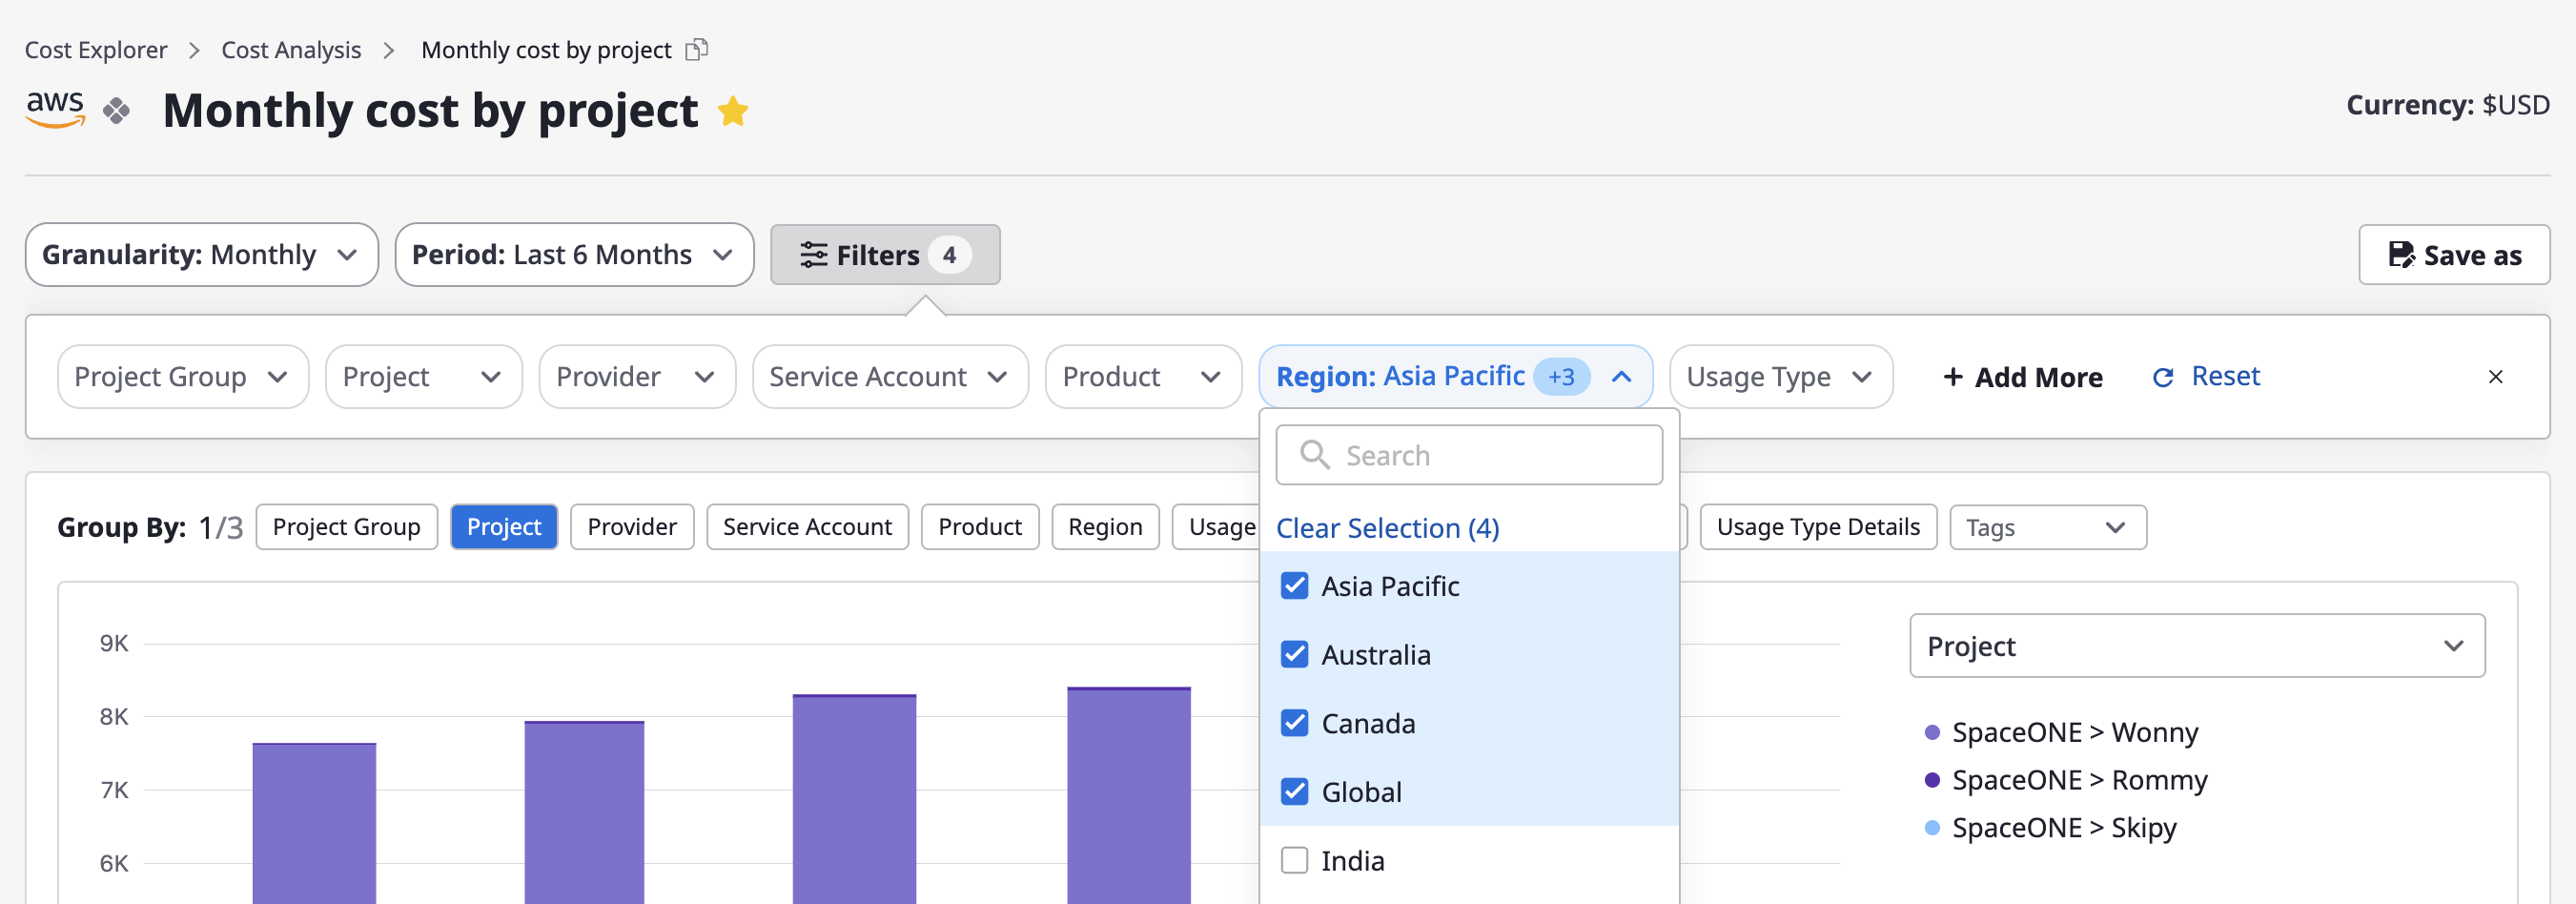
Filter settings
Filters, similar to group-by, can be selected one or more at a time, and your configured values are used for filtering with an "AND" condition.
(1) Click the [Filter] button at the top of the page.
(2) When the "Filter Settings" window opens, you can choose the desired filters, and the selections will be immediately reflected in the chart and table.
Creating/managing custom cost analysis
Creating a custom analysis page
To alleviate the inconvenience of having to reset granularity and period every time you enter the "Cost Analysis" page, a feature is provided that allows you to save frequently used settings as custom analysis pages.
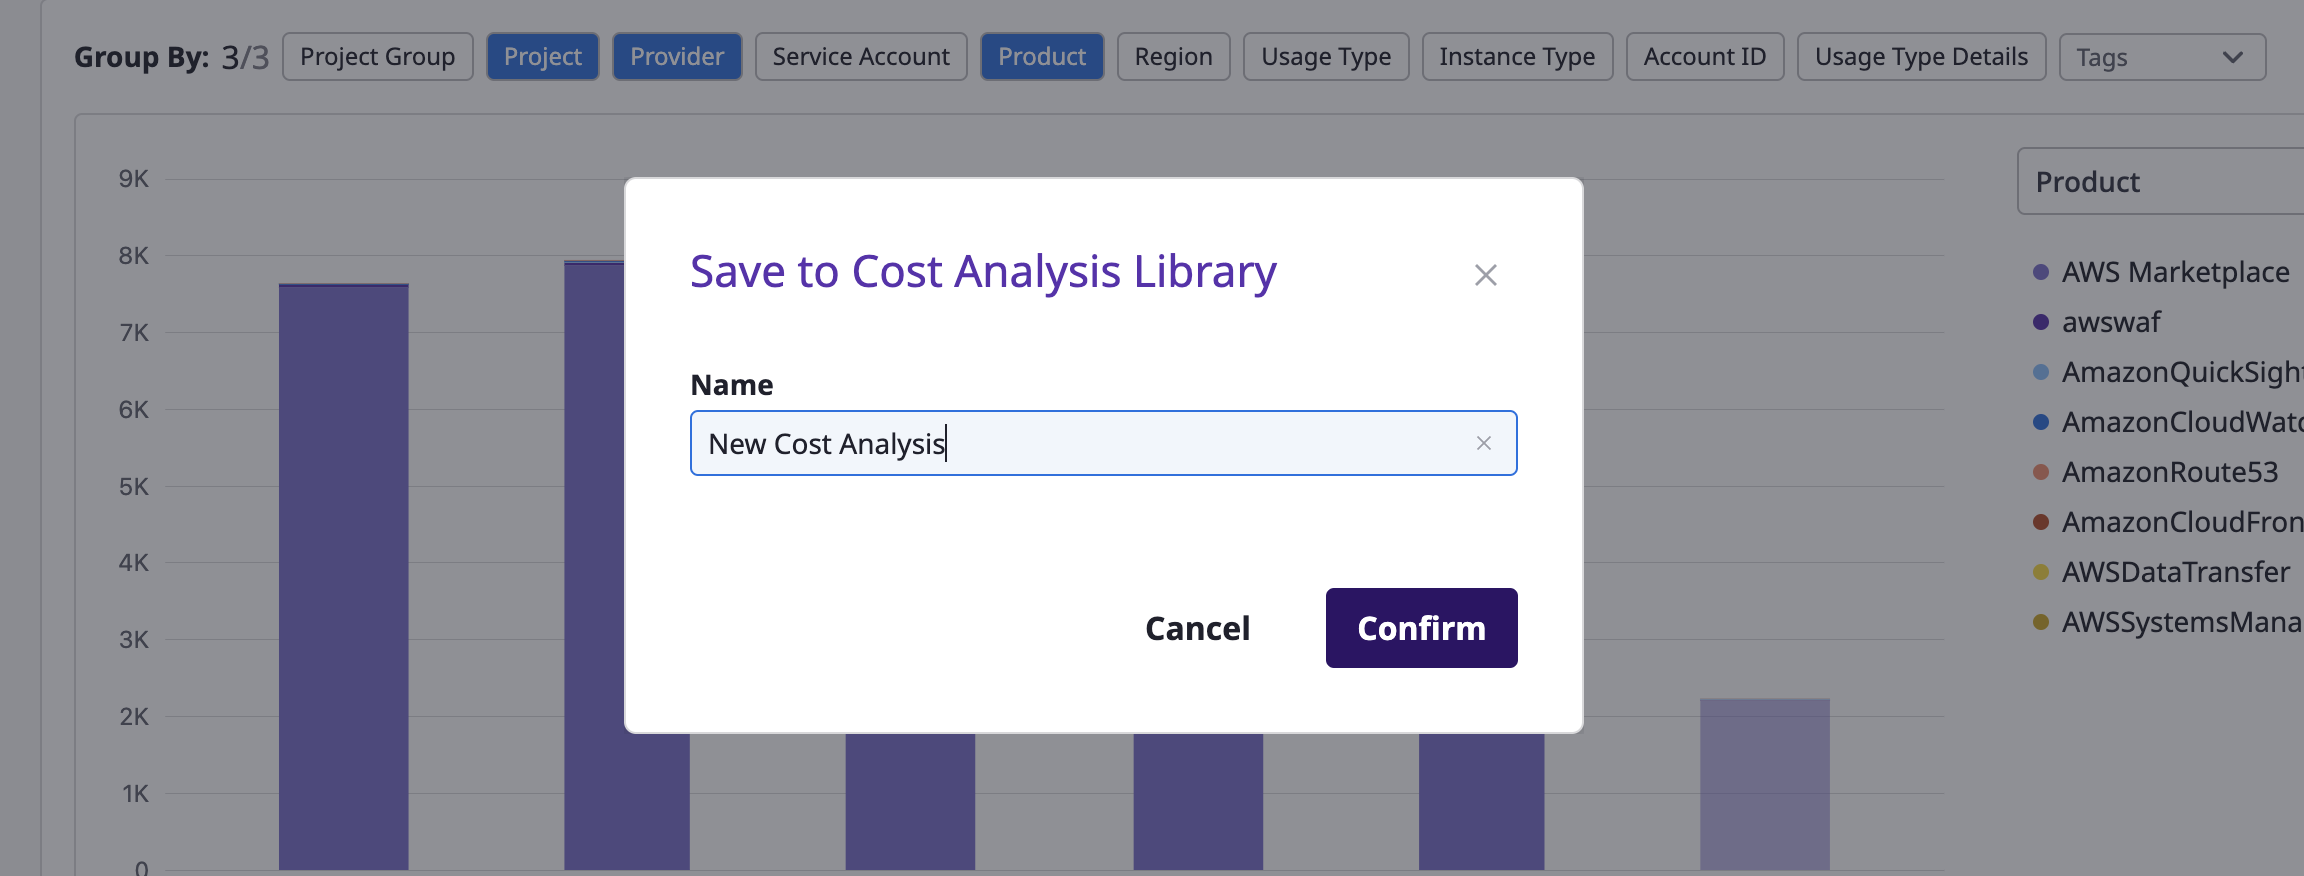
(1) Click the [Save As] button in the upper-right corner of a specific cost analysis page.
(2) After entering a name and clicking the [Confirm] button, a new analysis page is created.
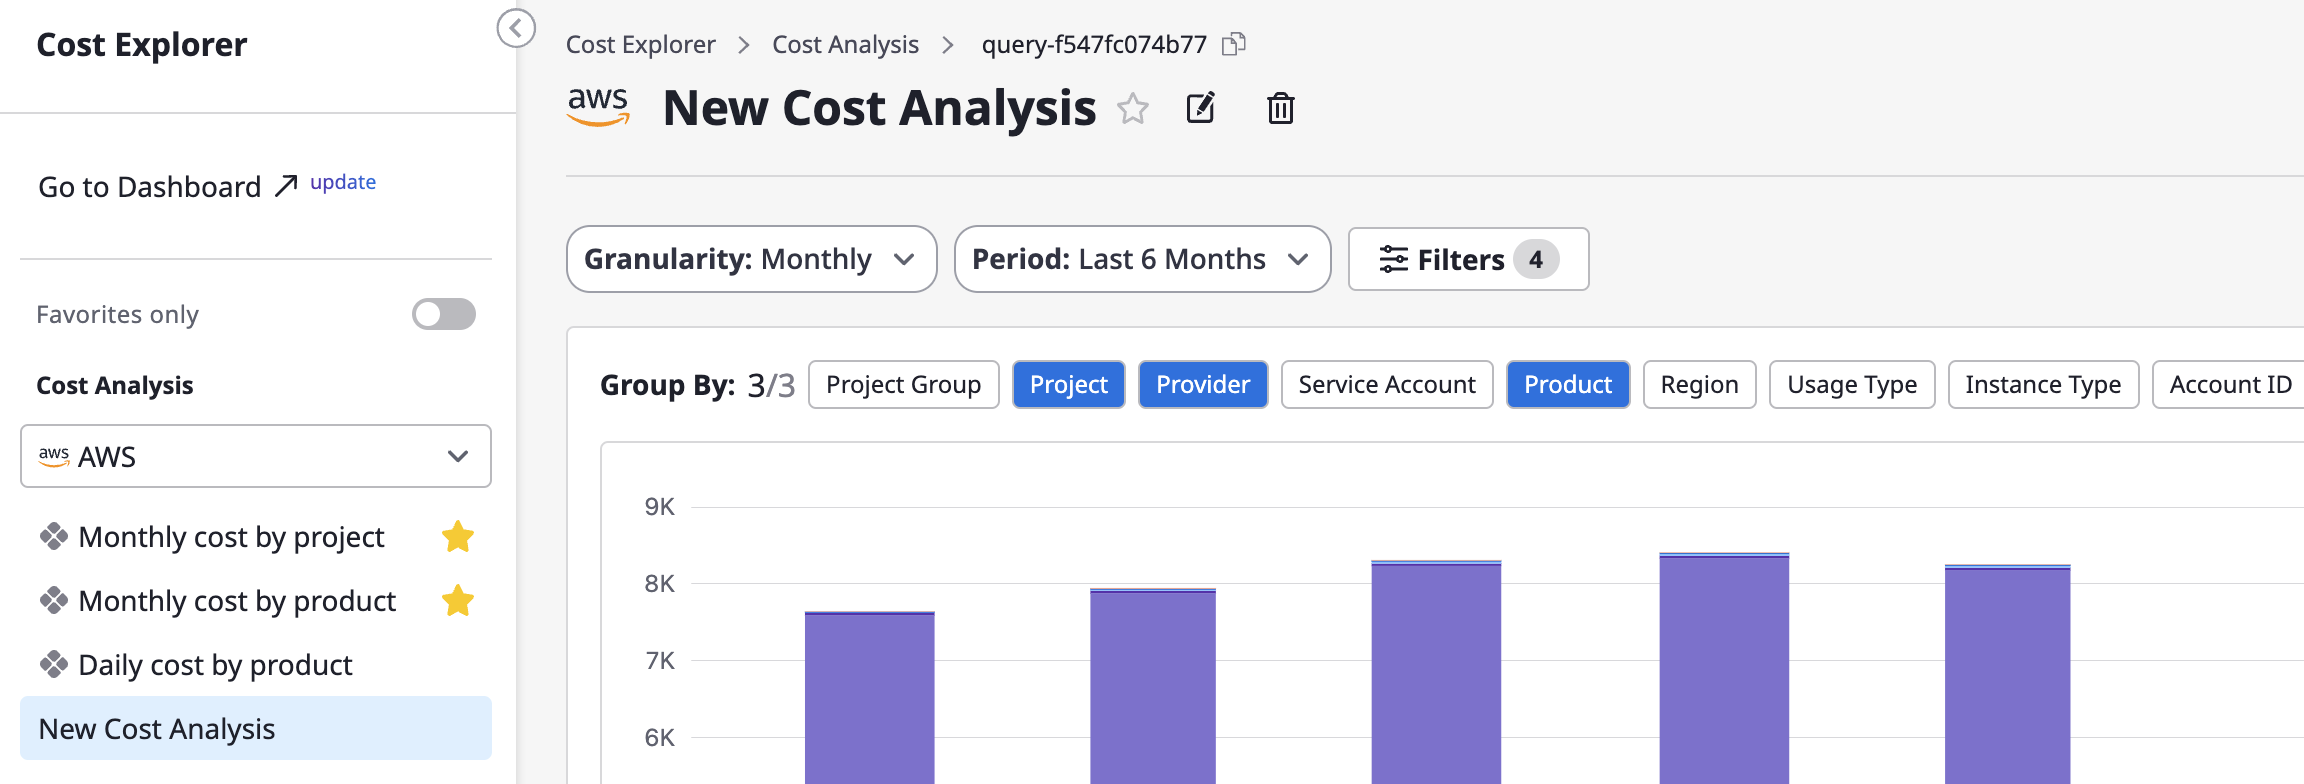
(3) Custom cost analysis pages can be saved with settings like name, filters, group-by, etc., directly using the [Save] option, and just like the default analysis pages, you can also create new pages by using [Save As].
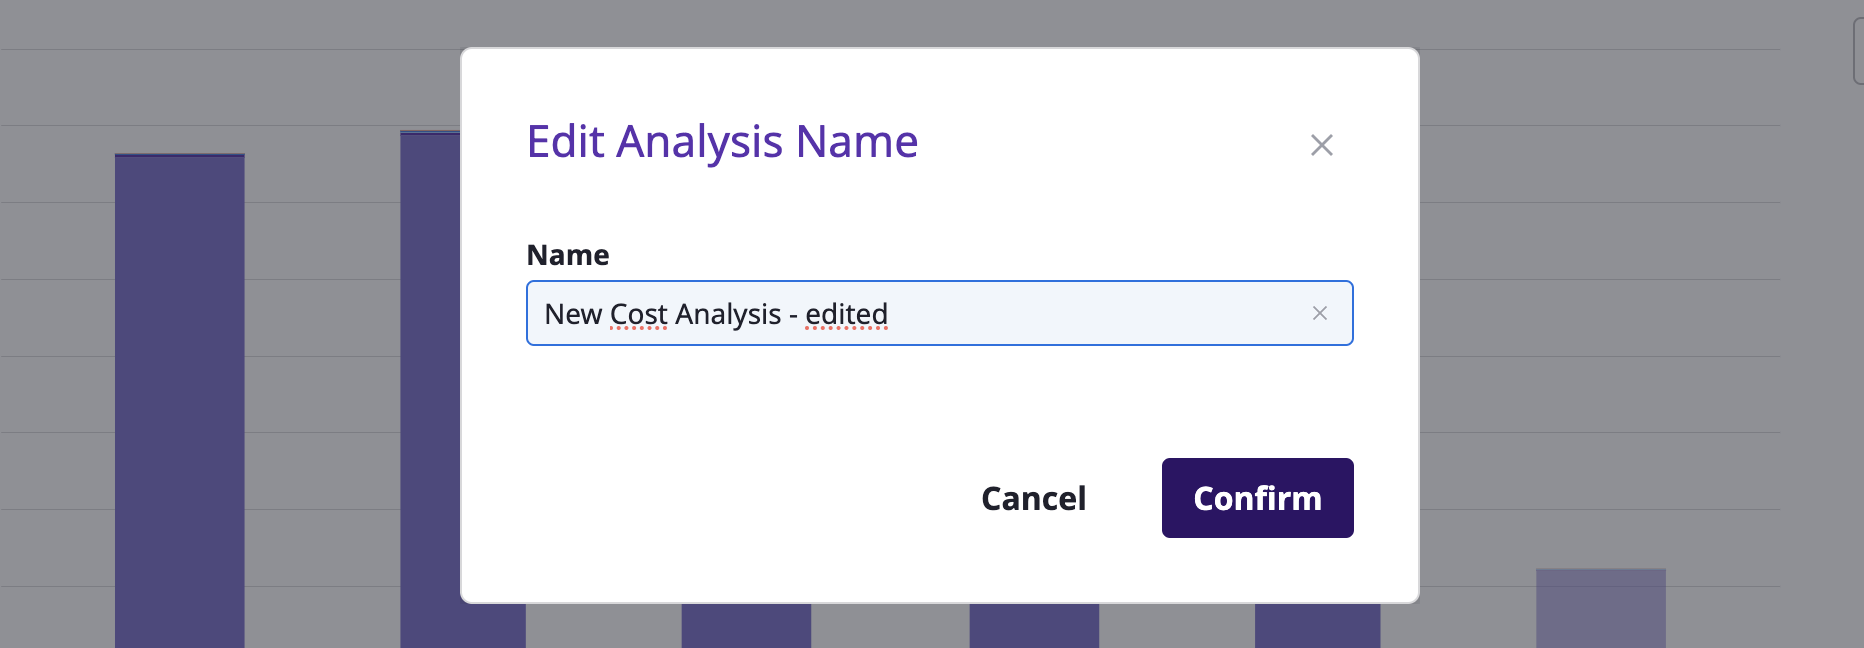
Editing the custom analysis name
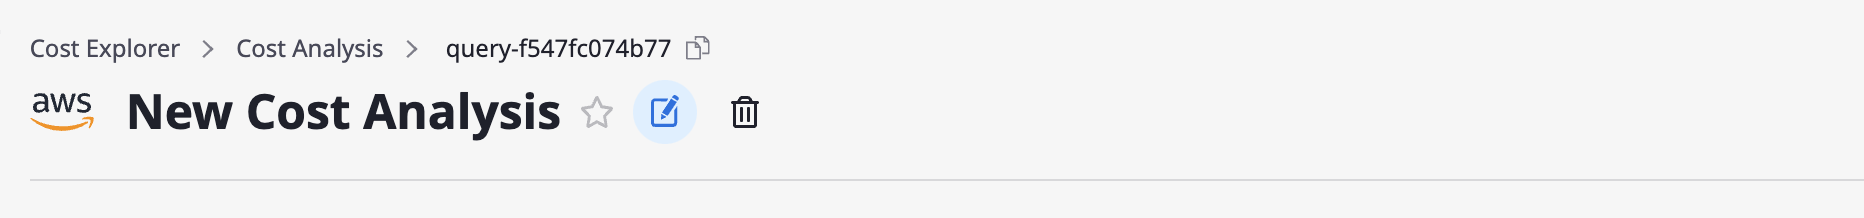
You can edit the name by clicking the [Edit] button at the top of the page.
Deleting the custom analysis name
You can delete the page by clicking the [Delete] button at the top of the page.

2 - Budget
Creating a budget
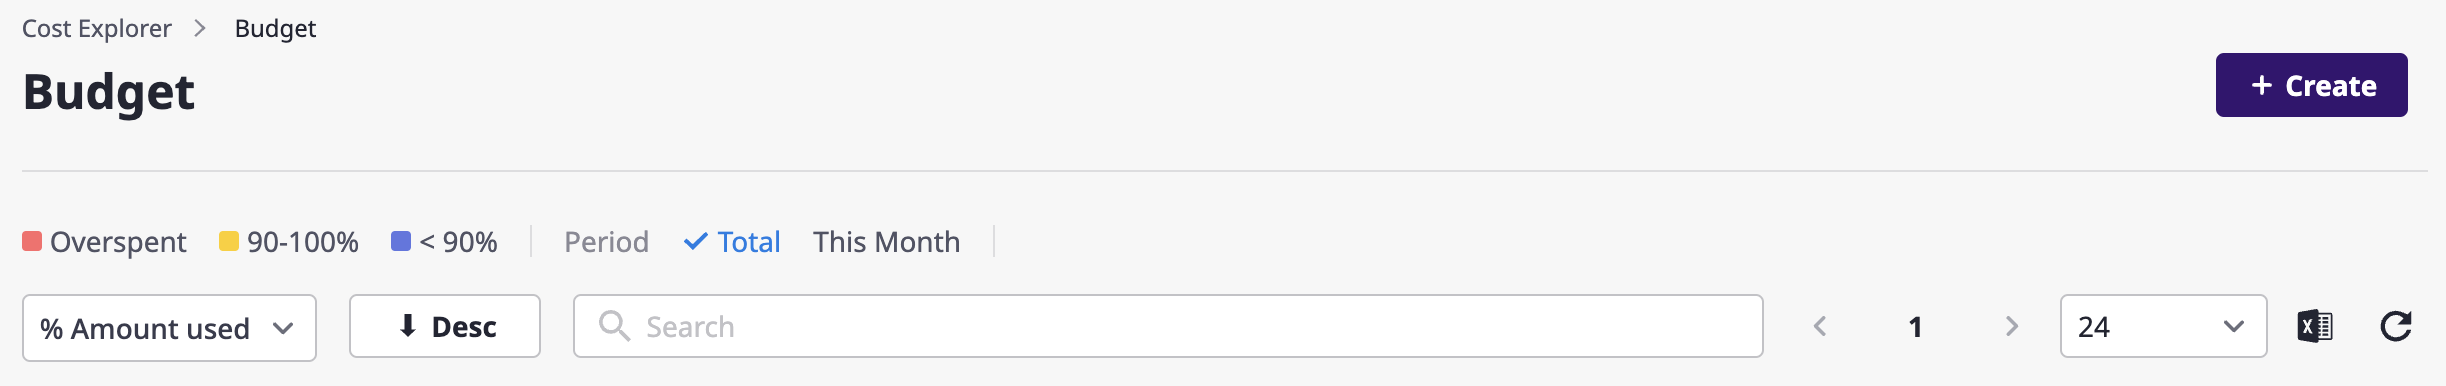
(1) Click the [Create budget] button at the top right of the [Cost Explorer > Budget] page.
(2) Enter basic information
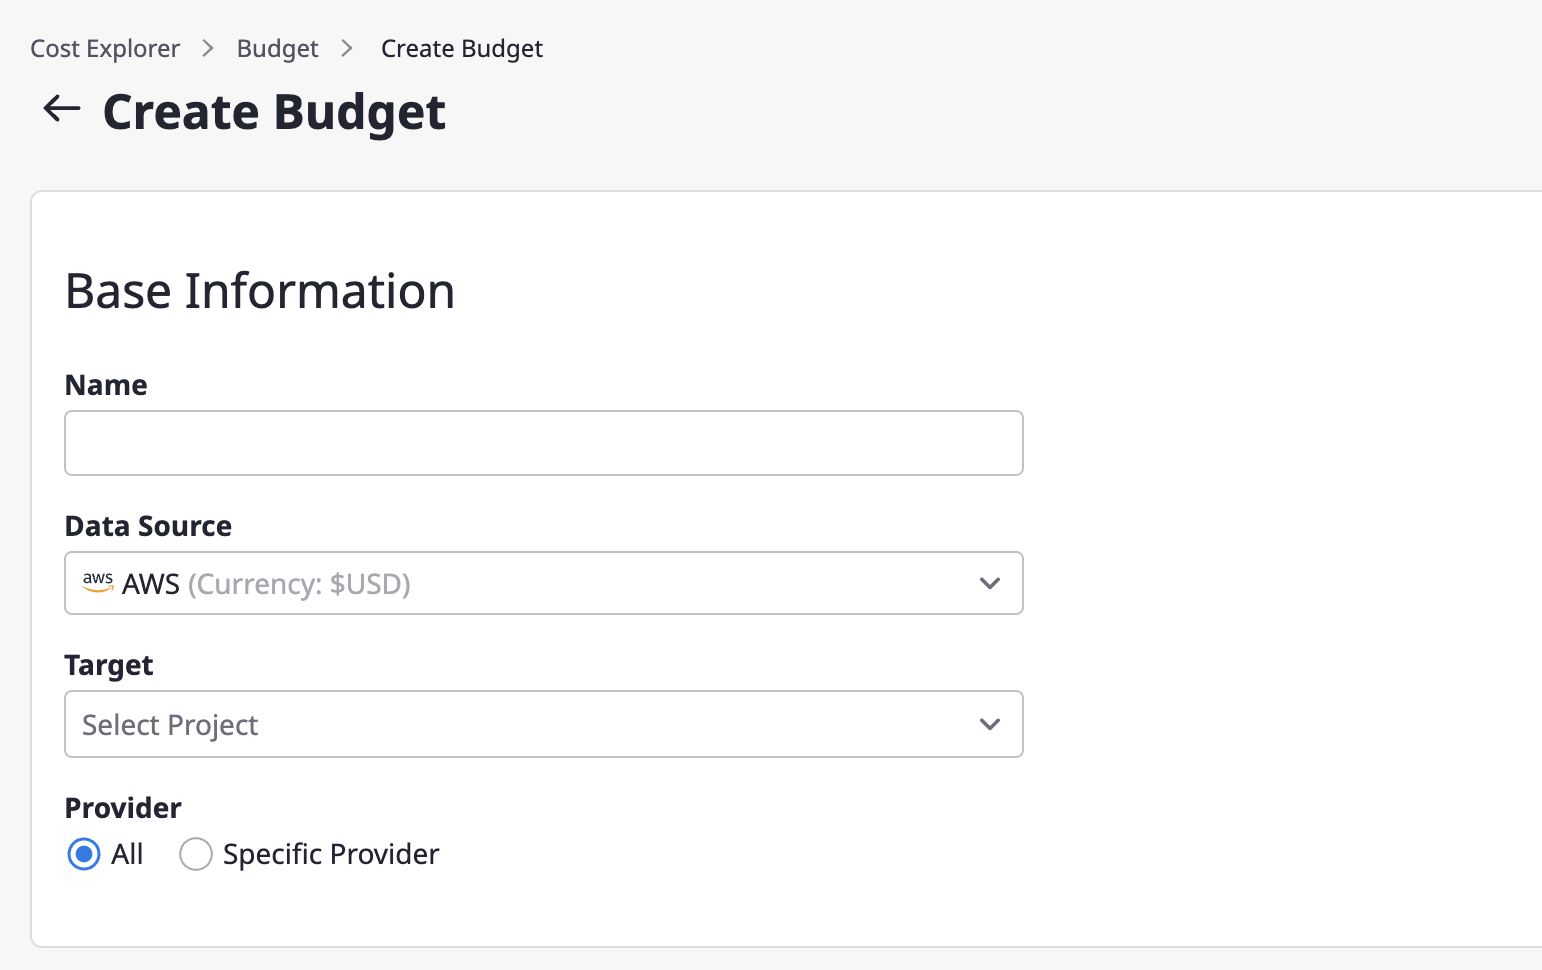
(2-1) Enter the name of the budget.
(2-2) Select a billing data source.
(2-3) Select the project to be the target of budget management in the target item.
(2-4) Select the cost incurring criteria. If you select all as the cost type, all cost data related to the corresponding project will be imported.
(3) Enter the budget plan
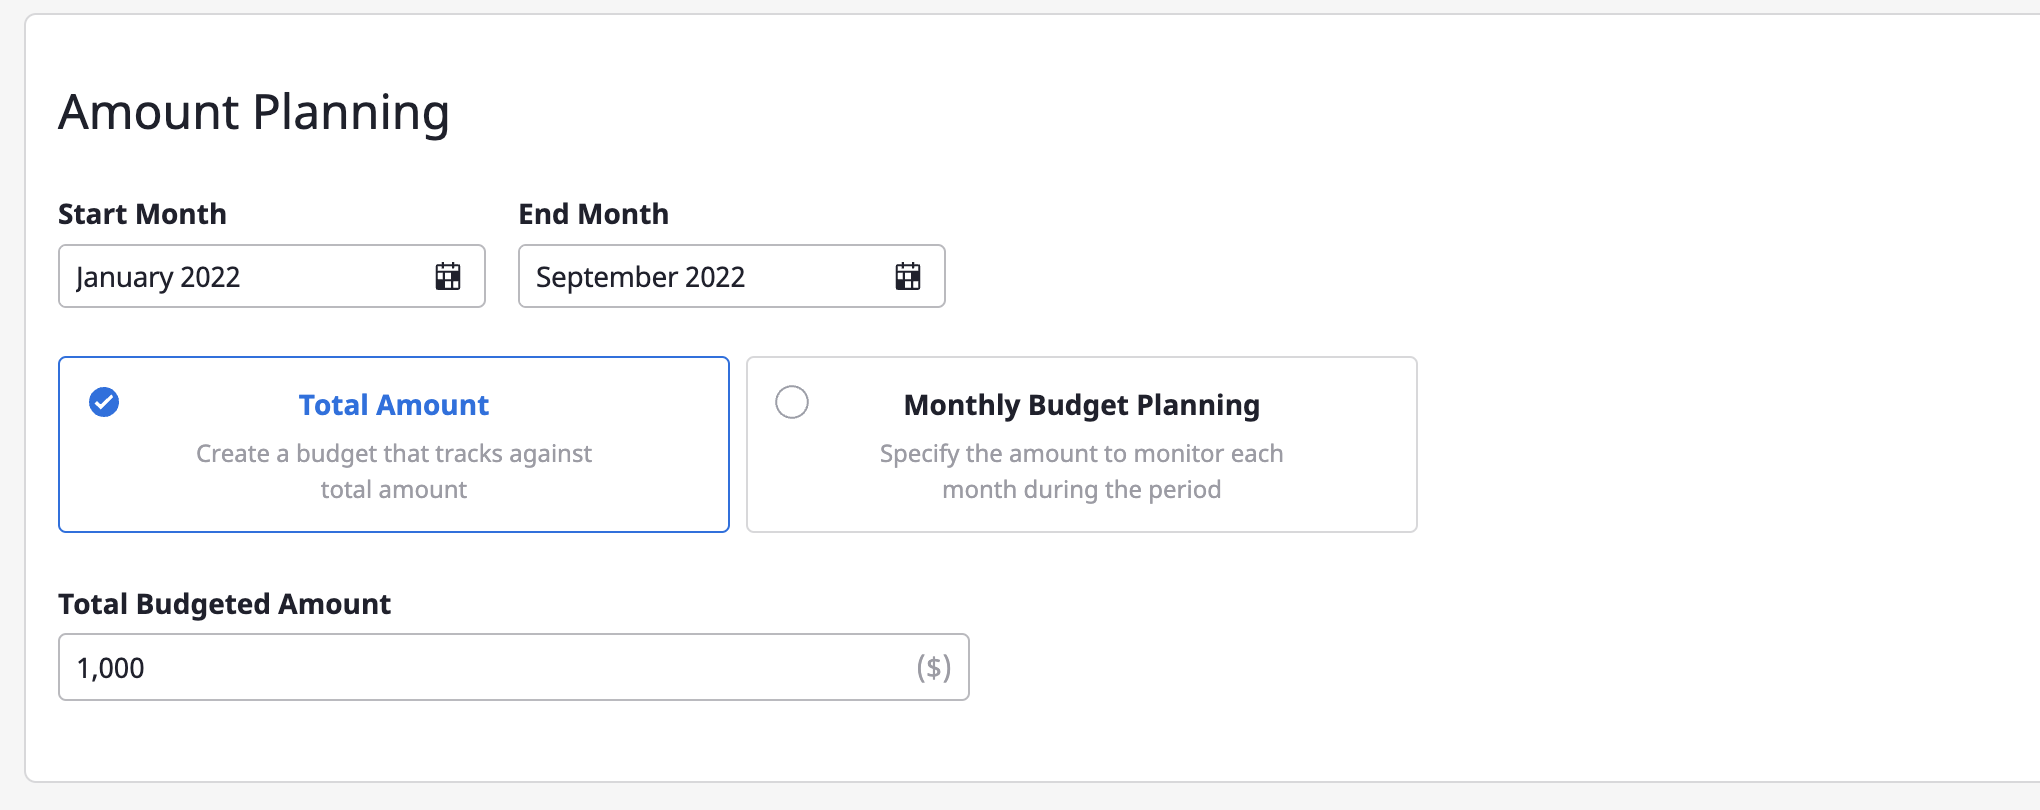
(3-1) Set a period for managing the budget.
(3-2) Choose how you want to manage your budget.
(3-3) Set the budget amount. If you selected Set total budget, enter the total budget amount. If you selected Set monthly budget, enter the monthly budget amount.
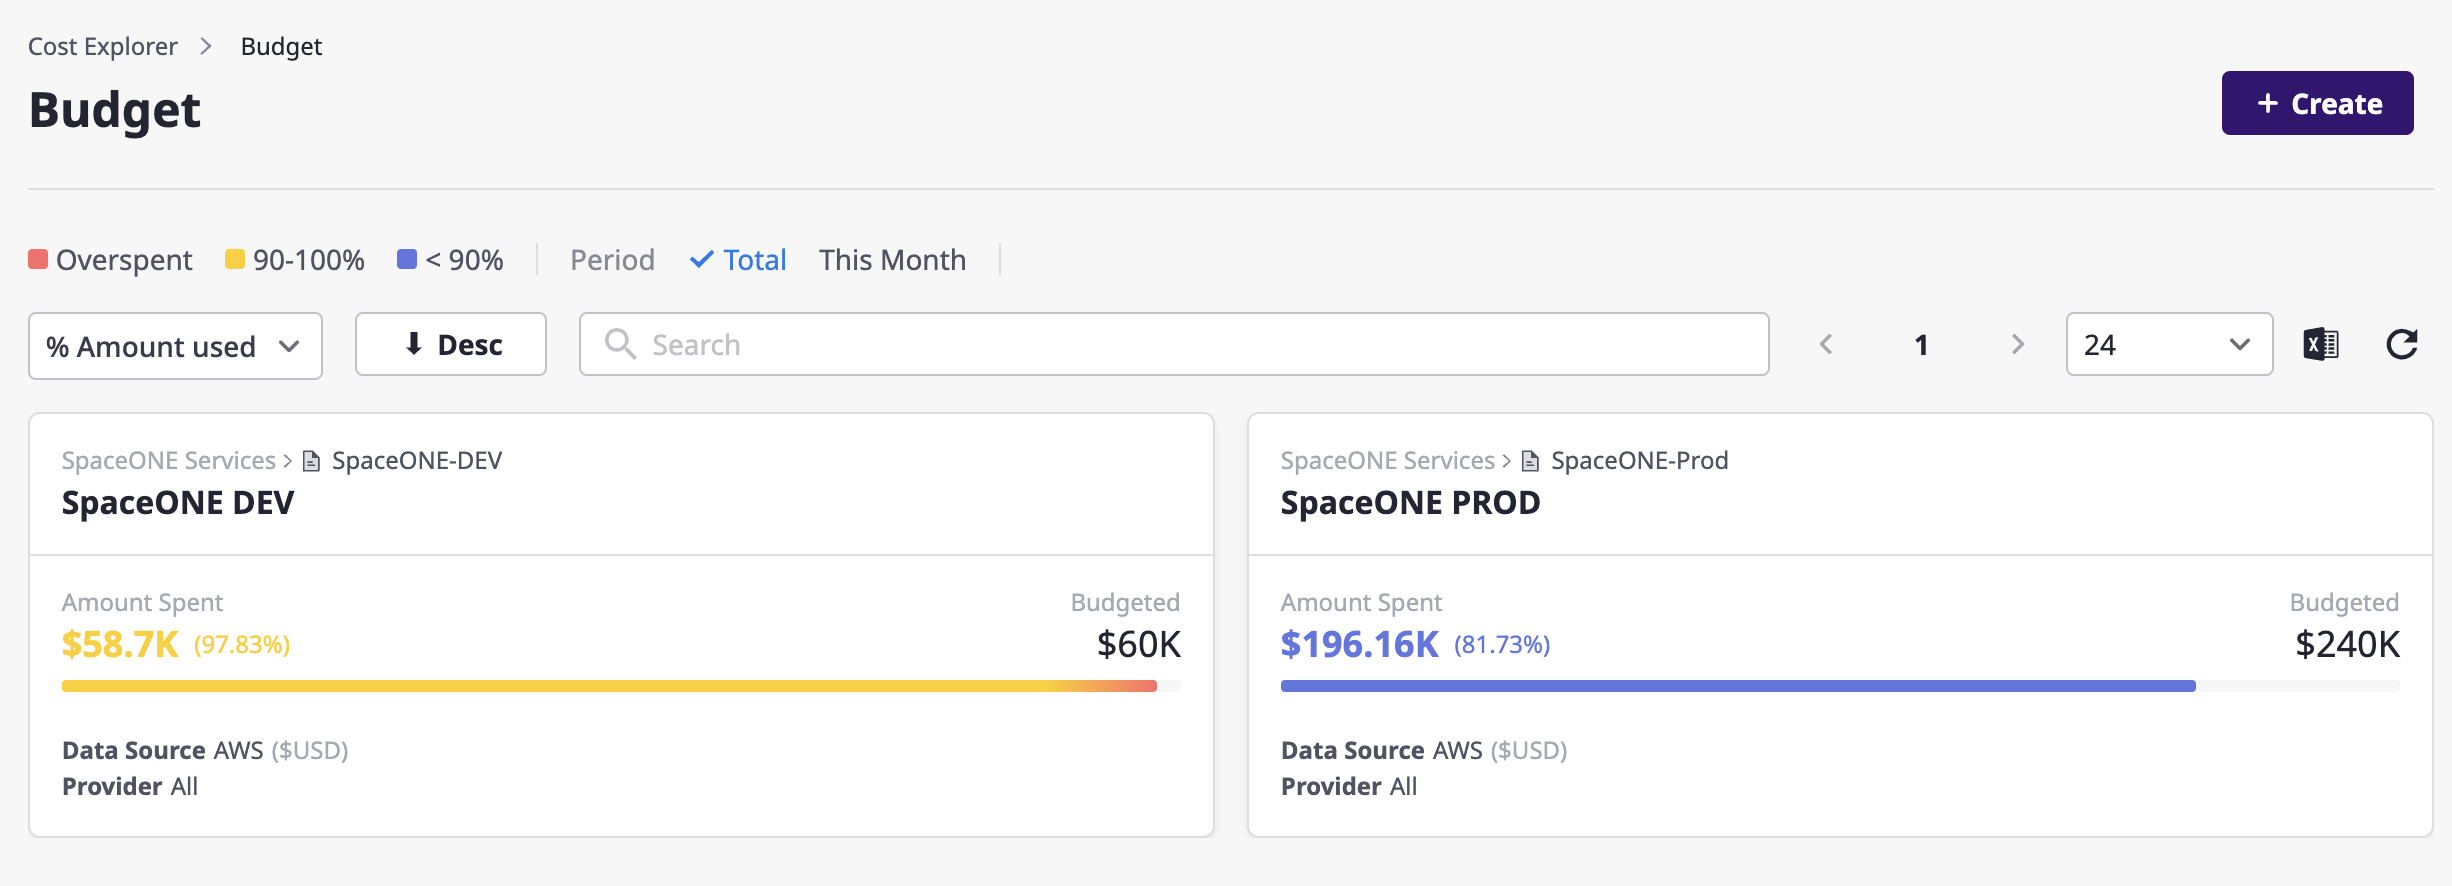
Check the set budget and usage status
The budget page provides a summary of your budget data and an overview of your budget for each project at a glance. You can use filters at the top to specify a period or apply an exchange rate, and you can search for a specific project or name using an advanced search.
Budget detail page
On the budget detail page, you can view specific data for the created budget.
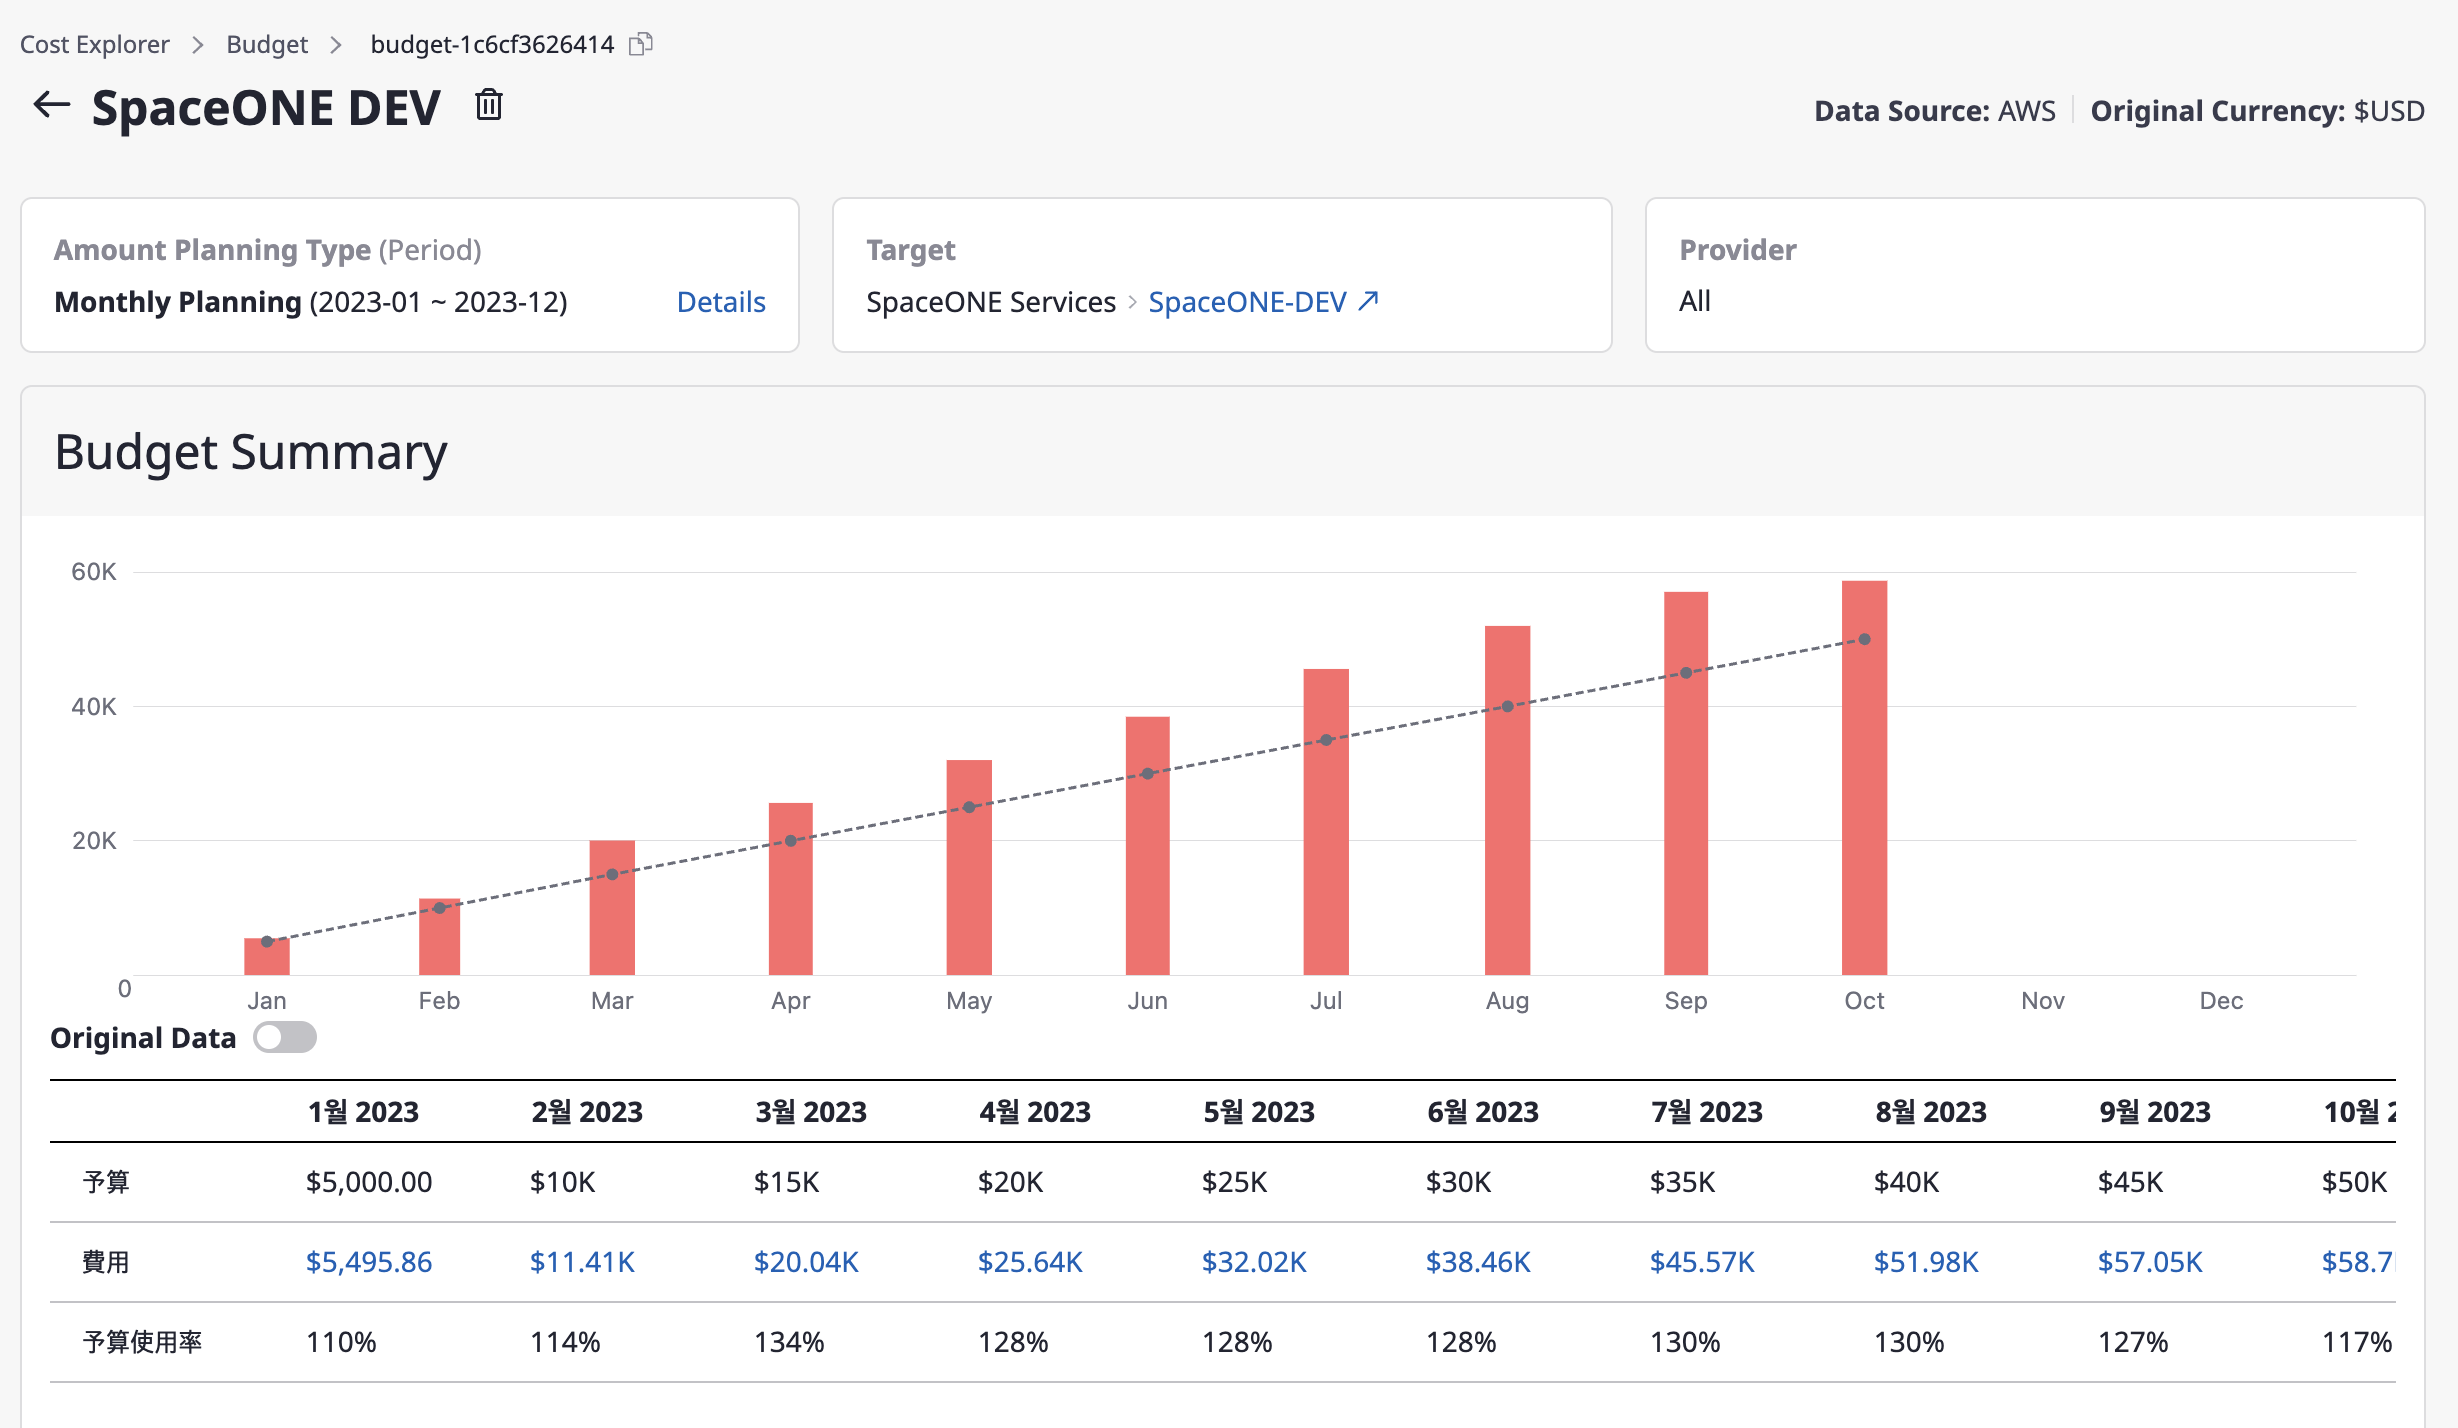
Budget summary
Under [Budget summary], you can check the monthly budget and cost trends through charts and tables.
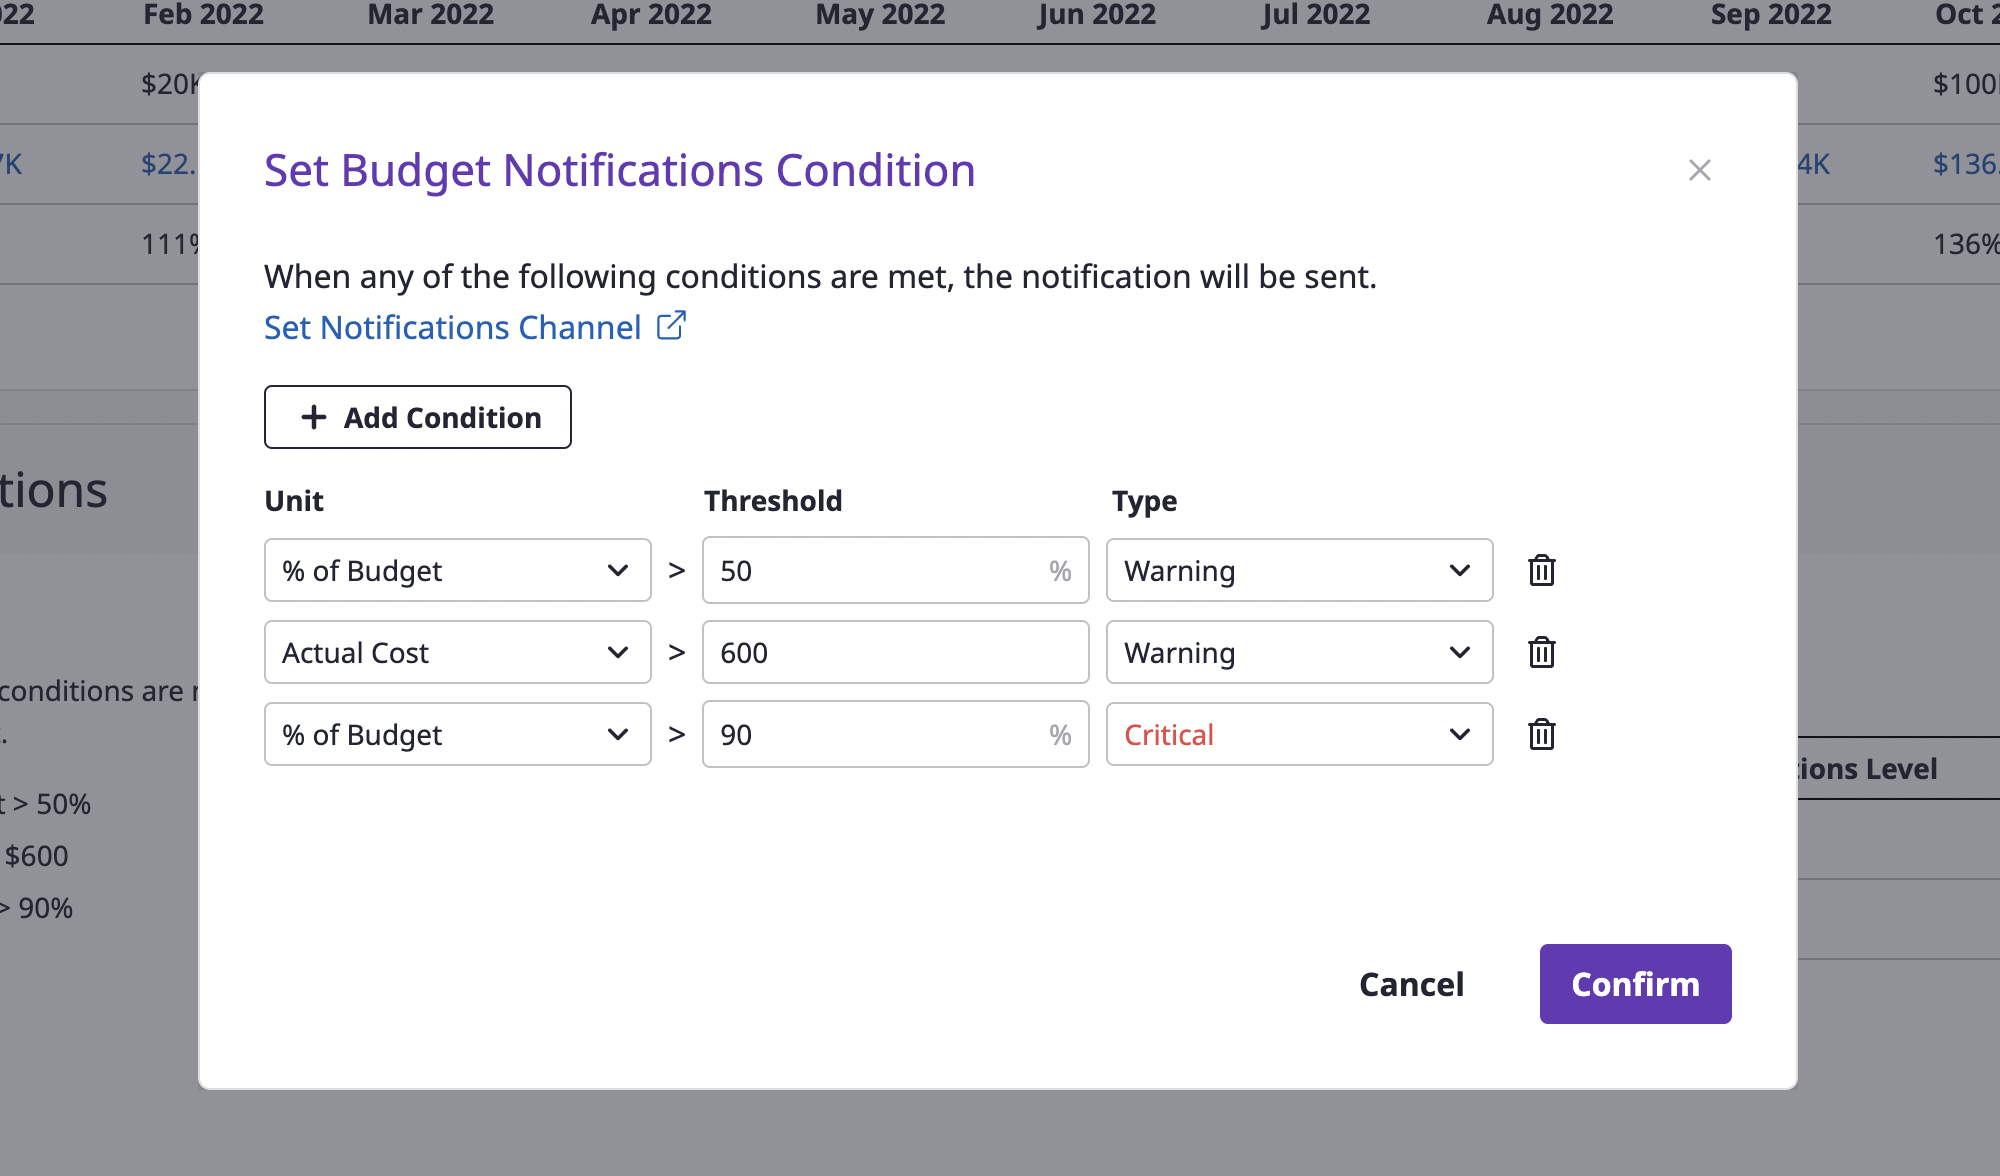
Set budget usage notifications
In [Budget usage notification settings], you can adjust the settings to receive a notification when the budget has been used up over a certain threshold. When the budget amount used goes over a certain percentage or the actual amount exceeds a certain amount, you can receive a notification through the notifications channel registered in advance.