This the multi-page printable view of this section. Click here to print.
Dashboards
You can create customized dashboards by combining specific widgets to gain a quick overview of your desired data in addition to the default provided dashboards. Furthermore, you can have precise control over variables, date ranges, and detailed options for each widget for each dashboard, allowing you to build and manage more accurate and professional dashboards tailored to your organization's requirements.
1 - Dashboard Templates
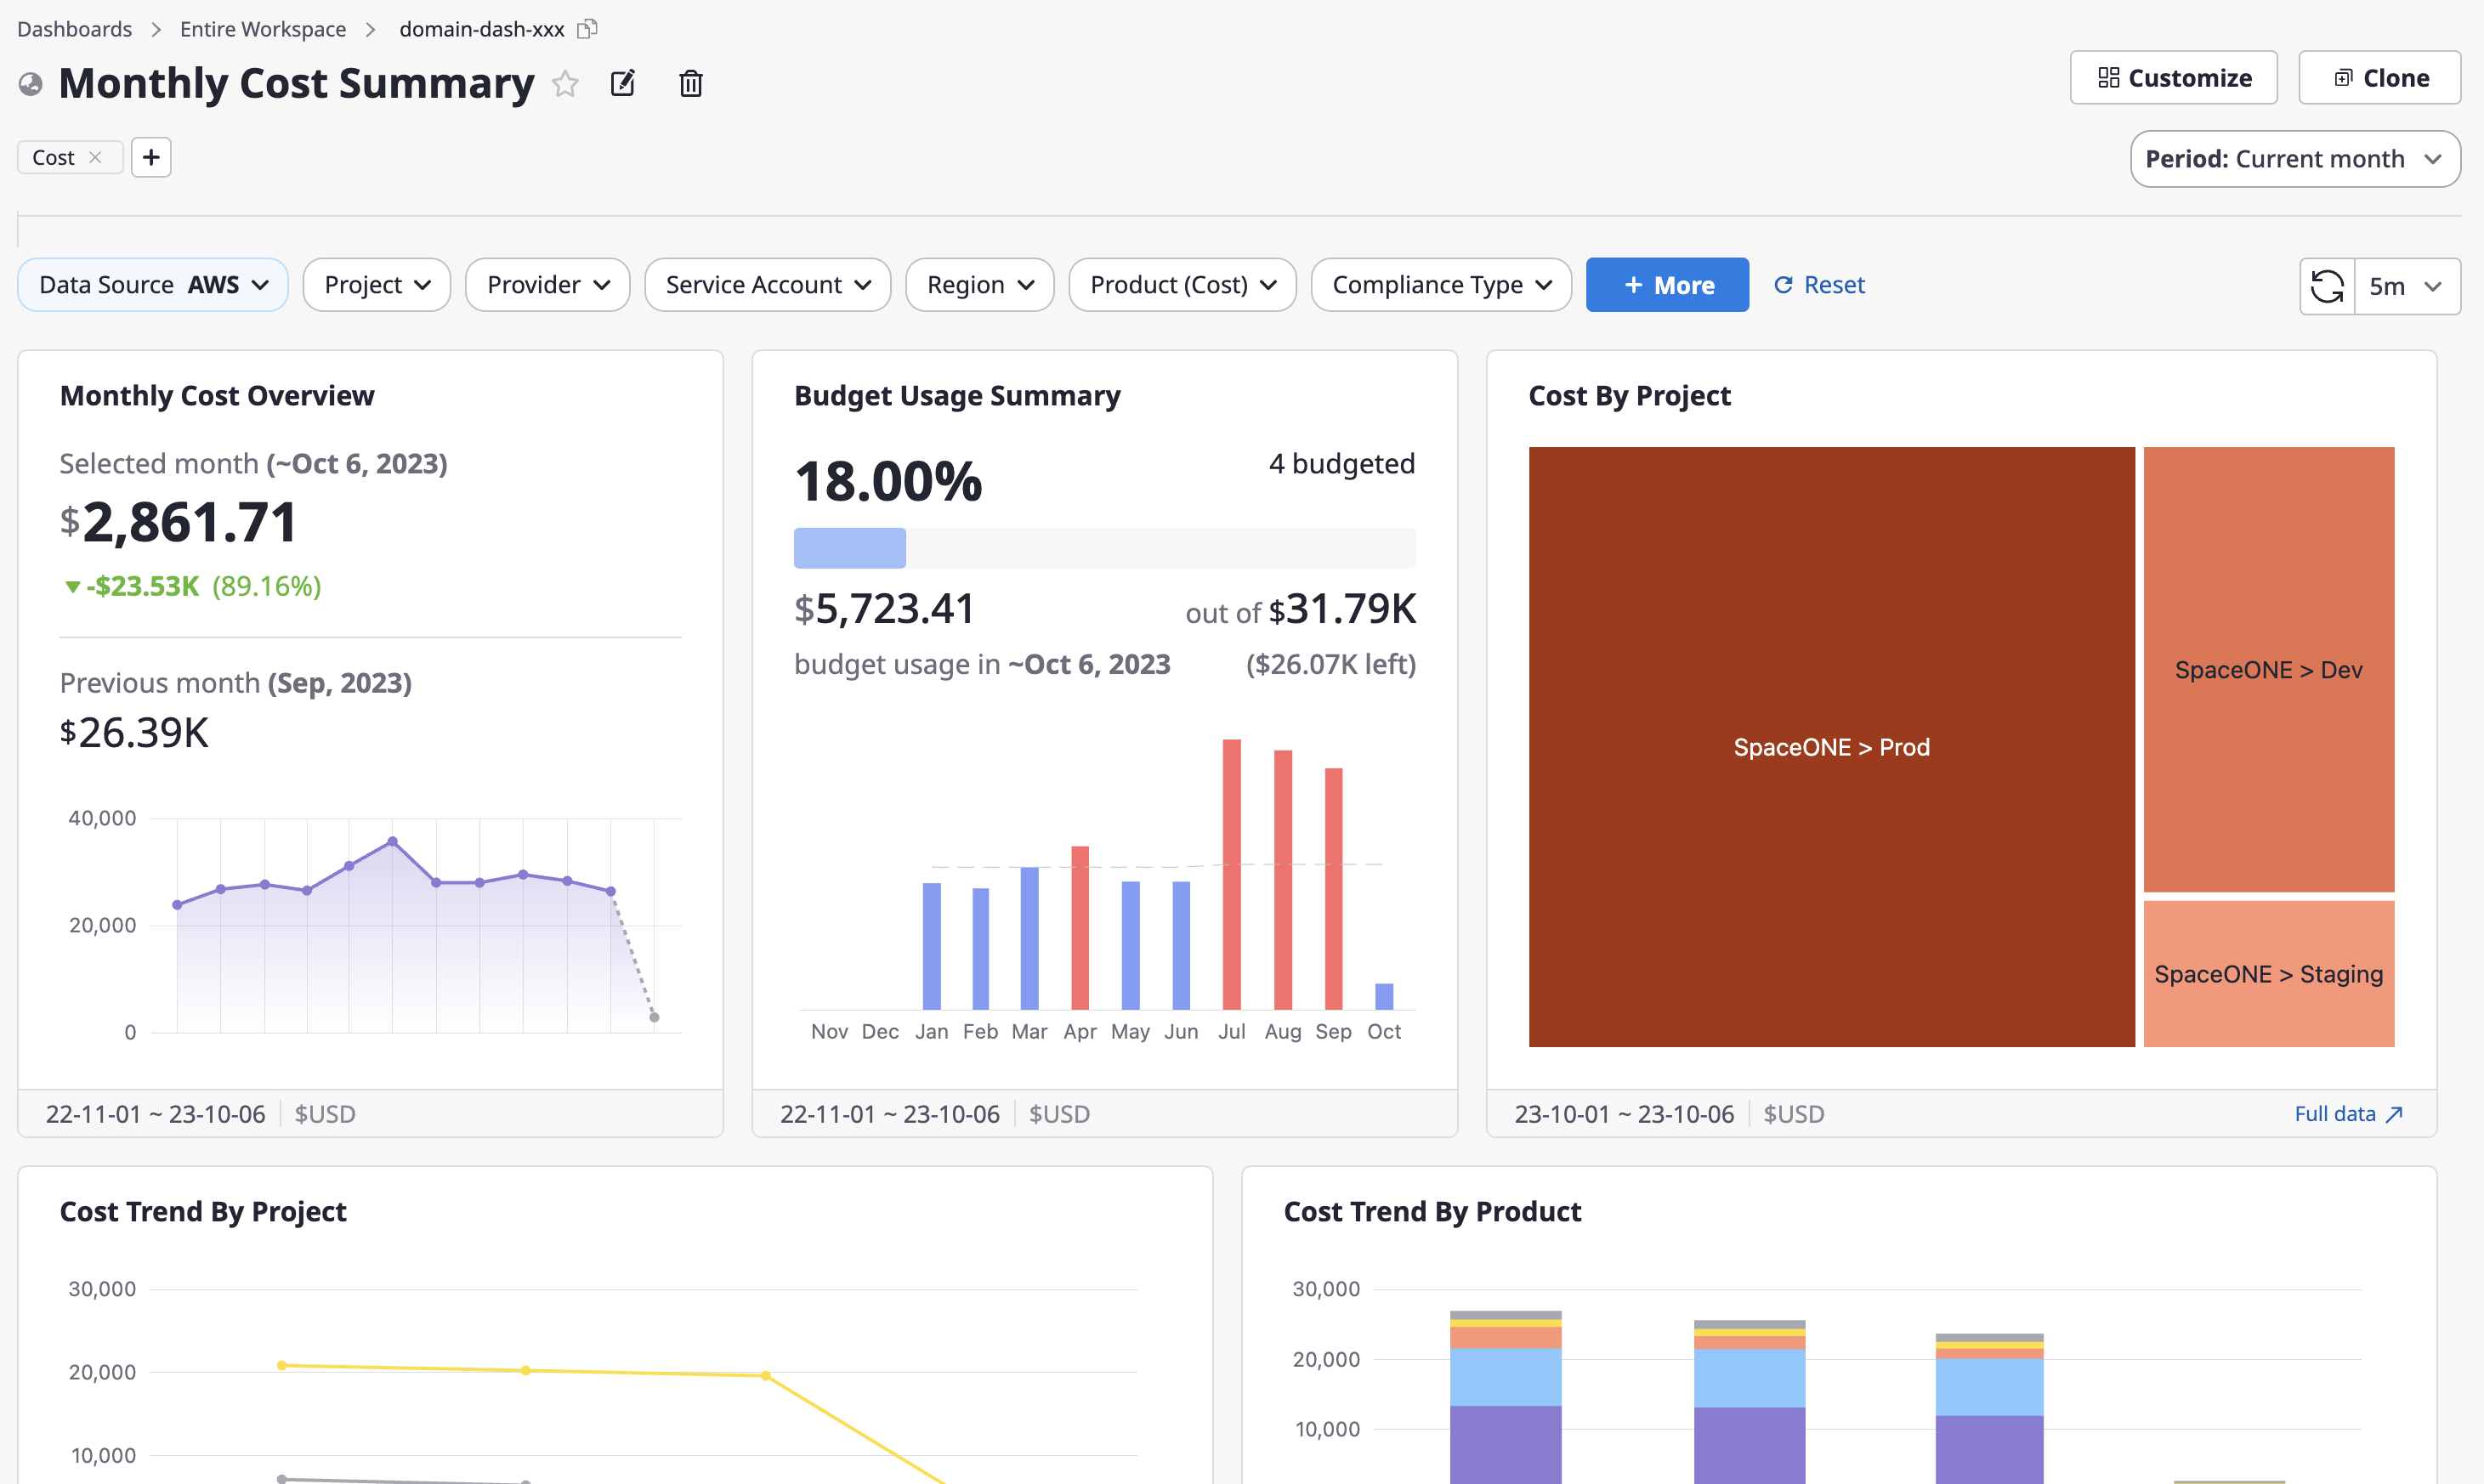
Monthly Cost Summary
This is a dashboard that visualizes cloud cost status and budget utilization based on various group-specific statistical criteria in the form of charts.
It is comprised of cost-related widgets, and among the dashboard variables, one specific Data-Source must be selected.
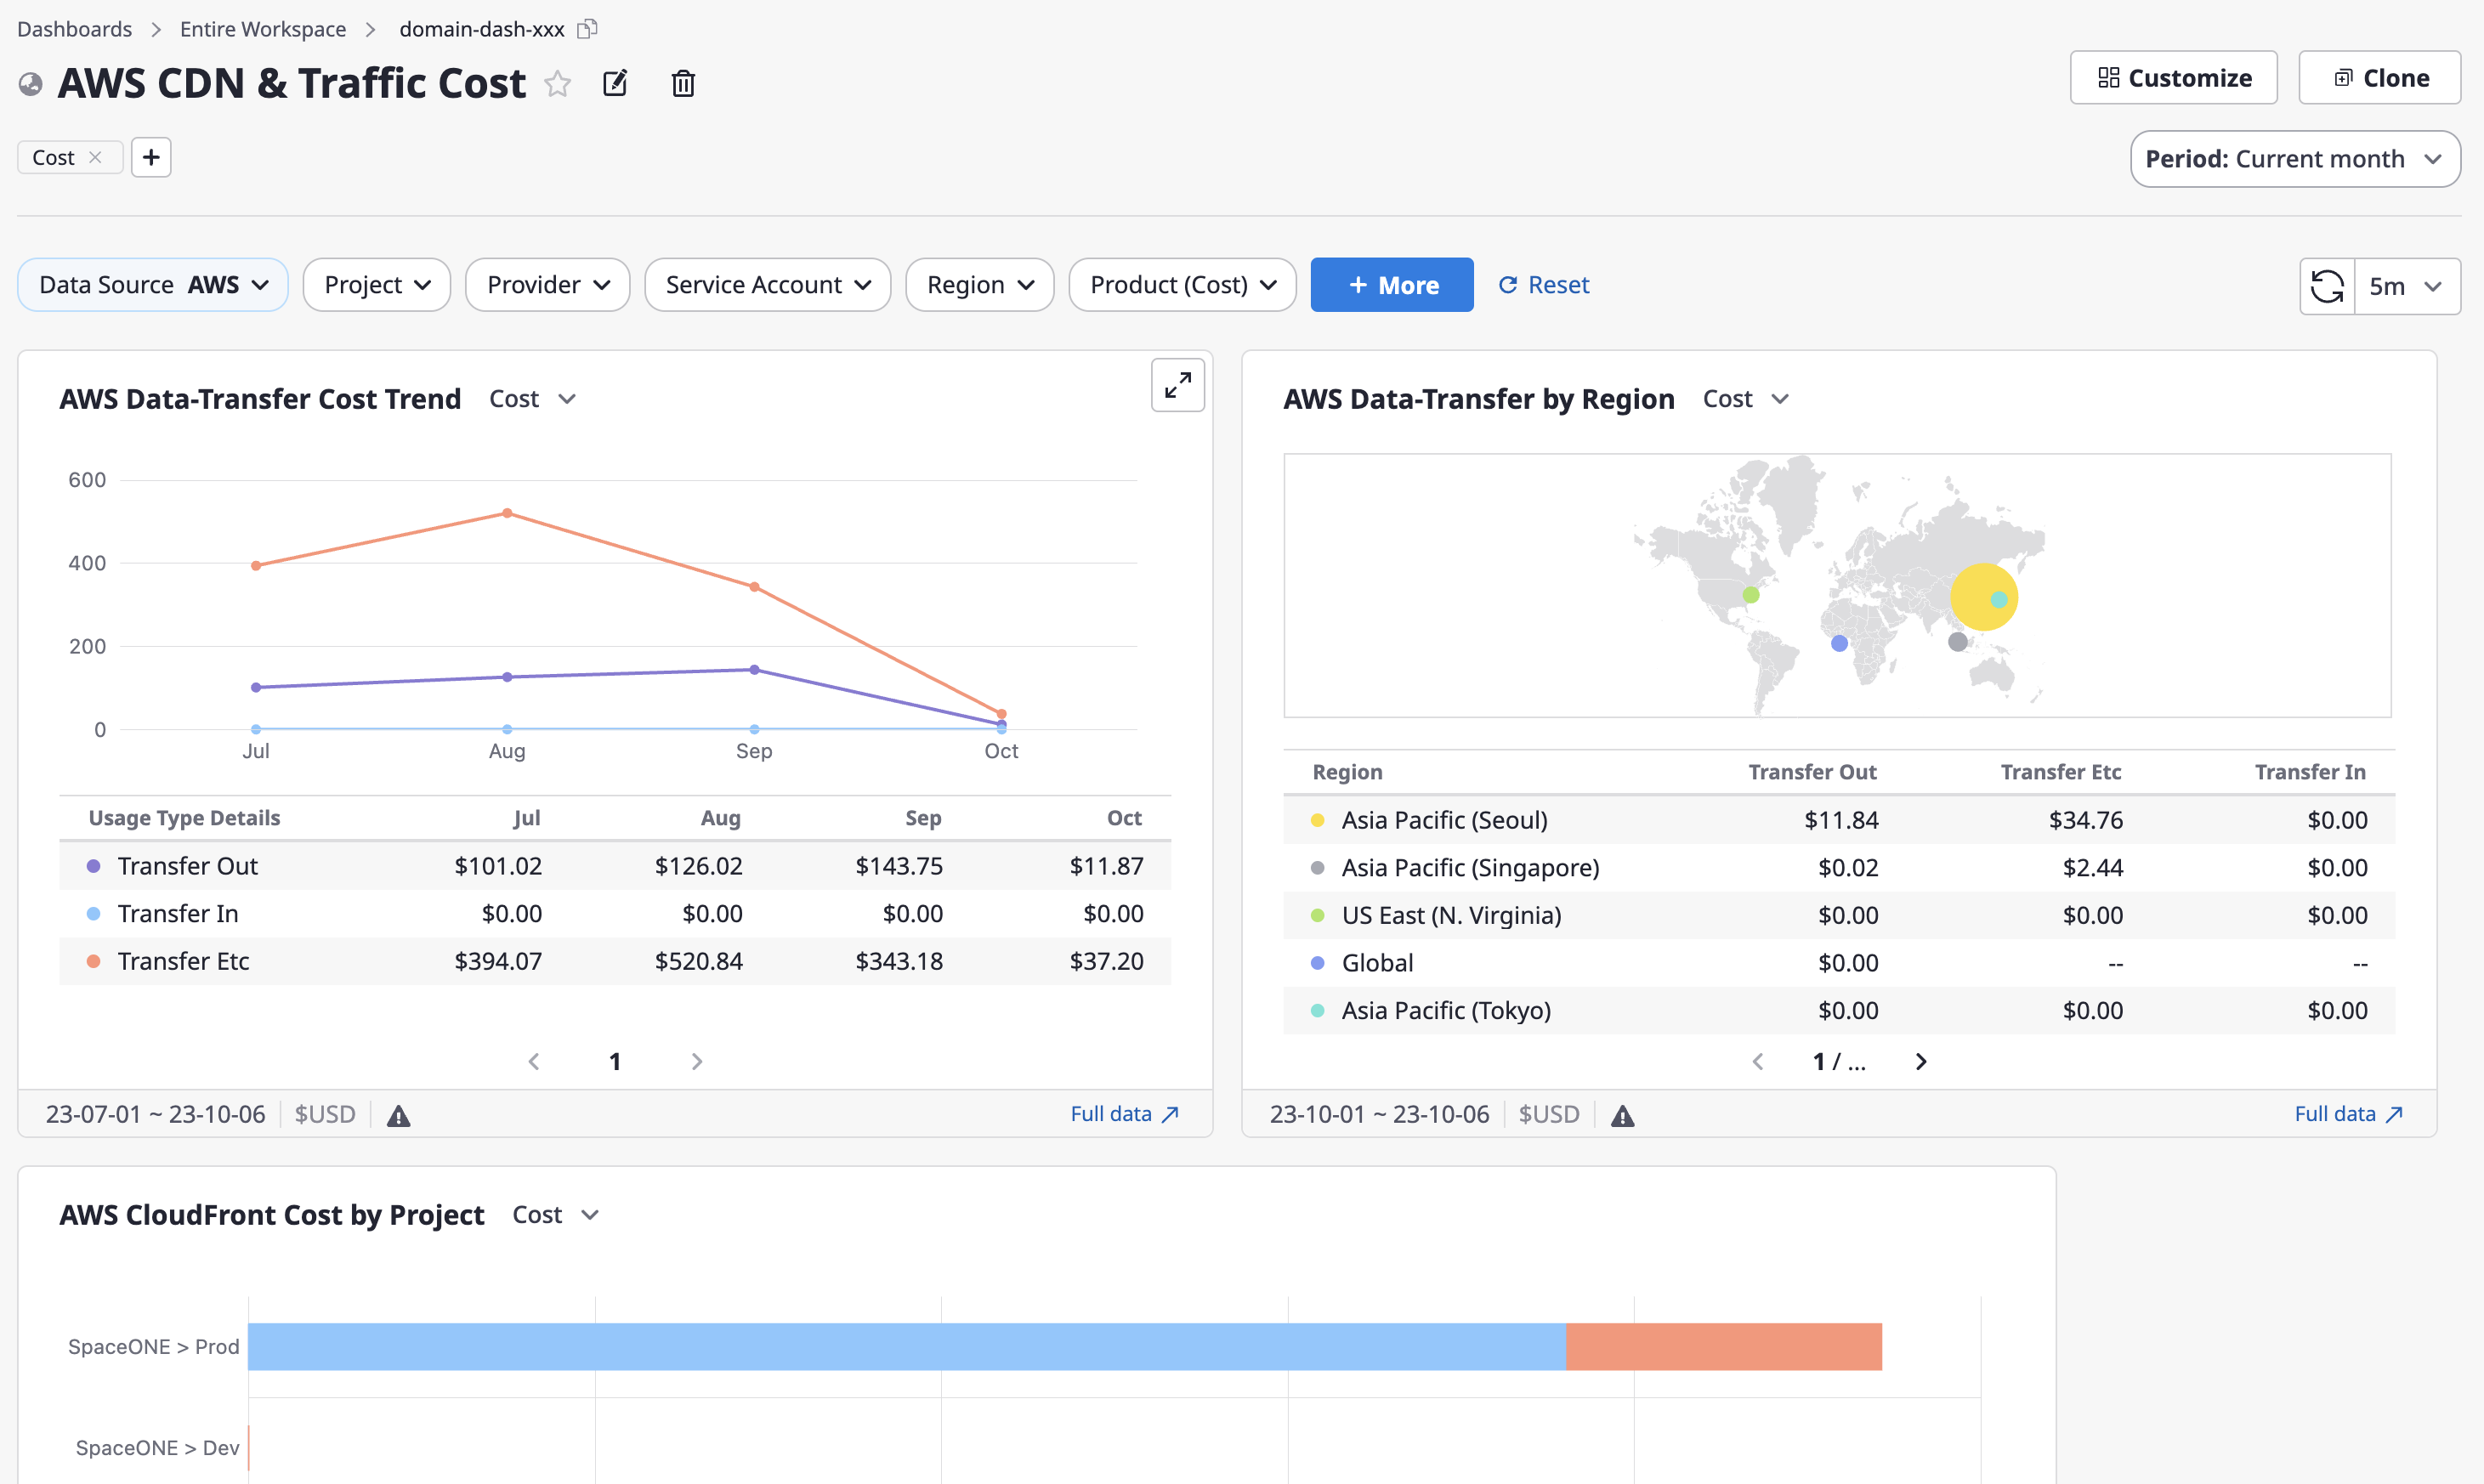
CDN & Traffic
This is a dashboard that charts the status of CDN and traffic-related costs and usage for a specific cloud product. One specific Data-Source must be selected.
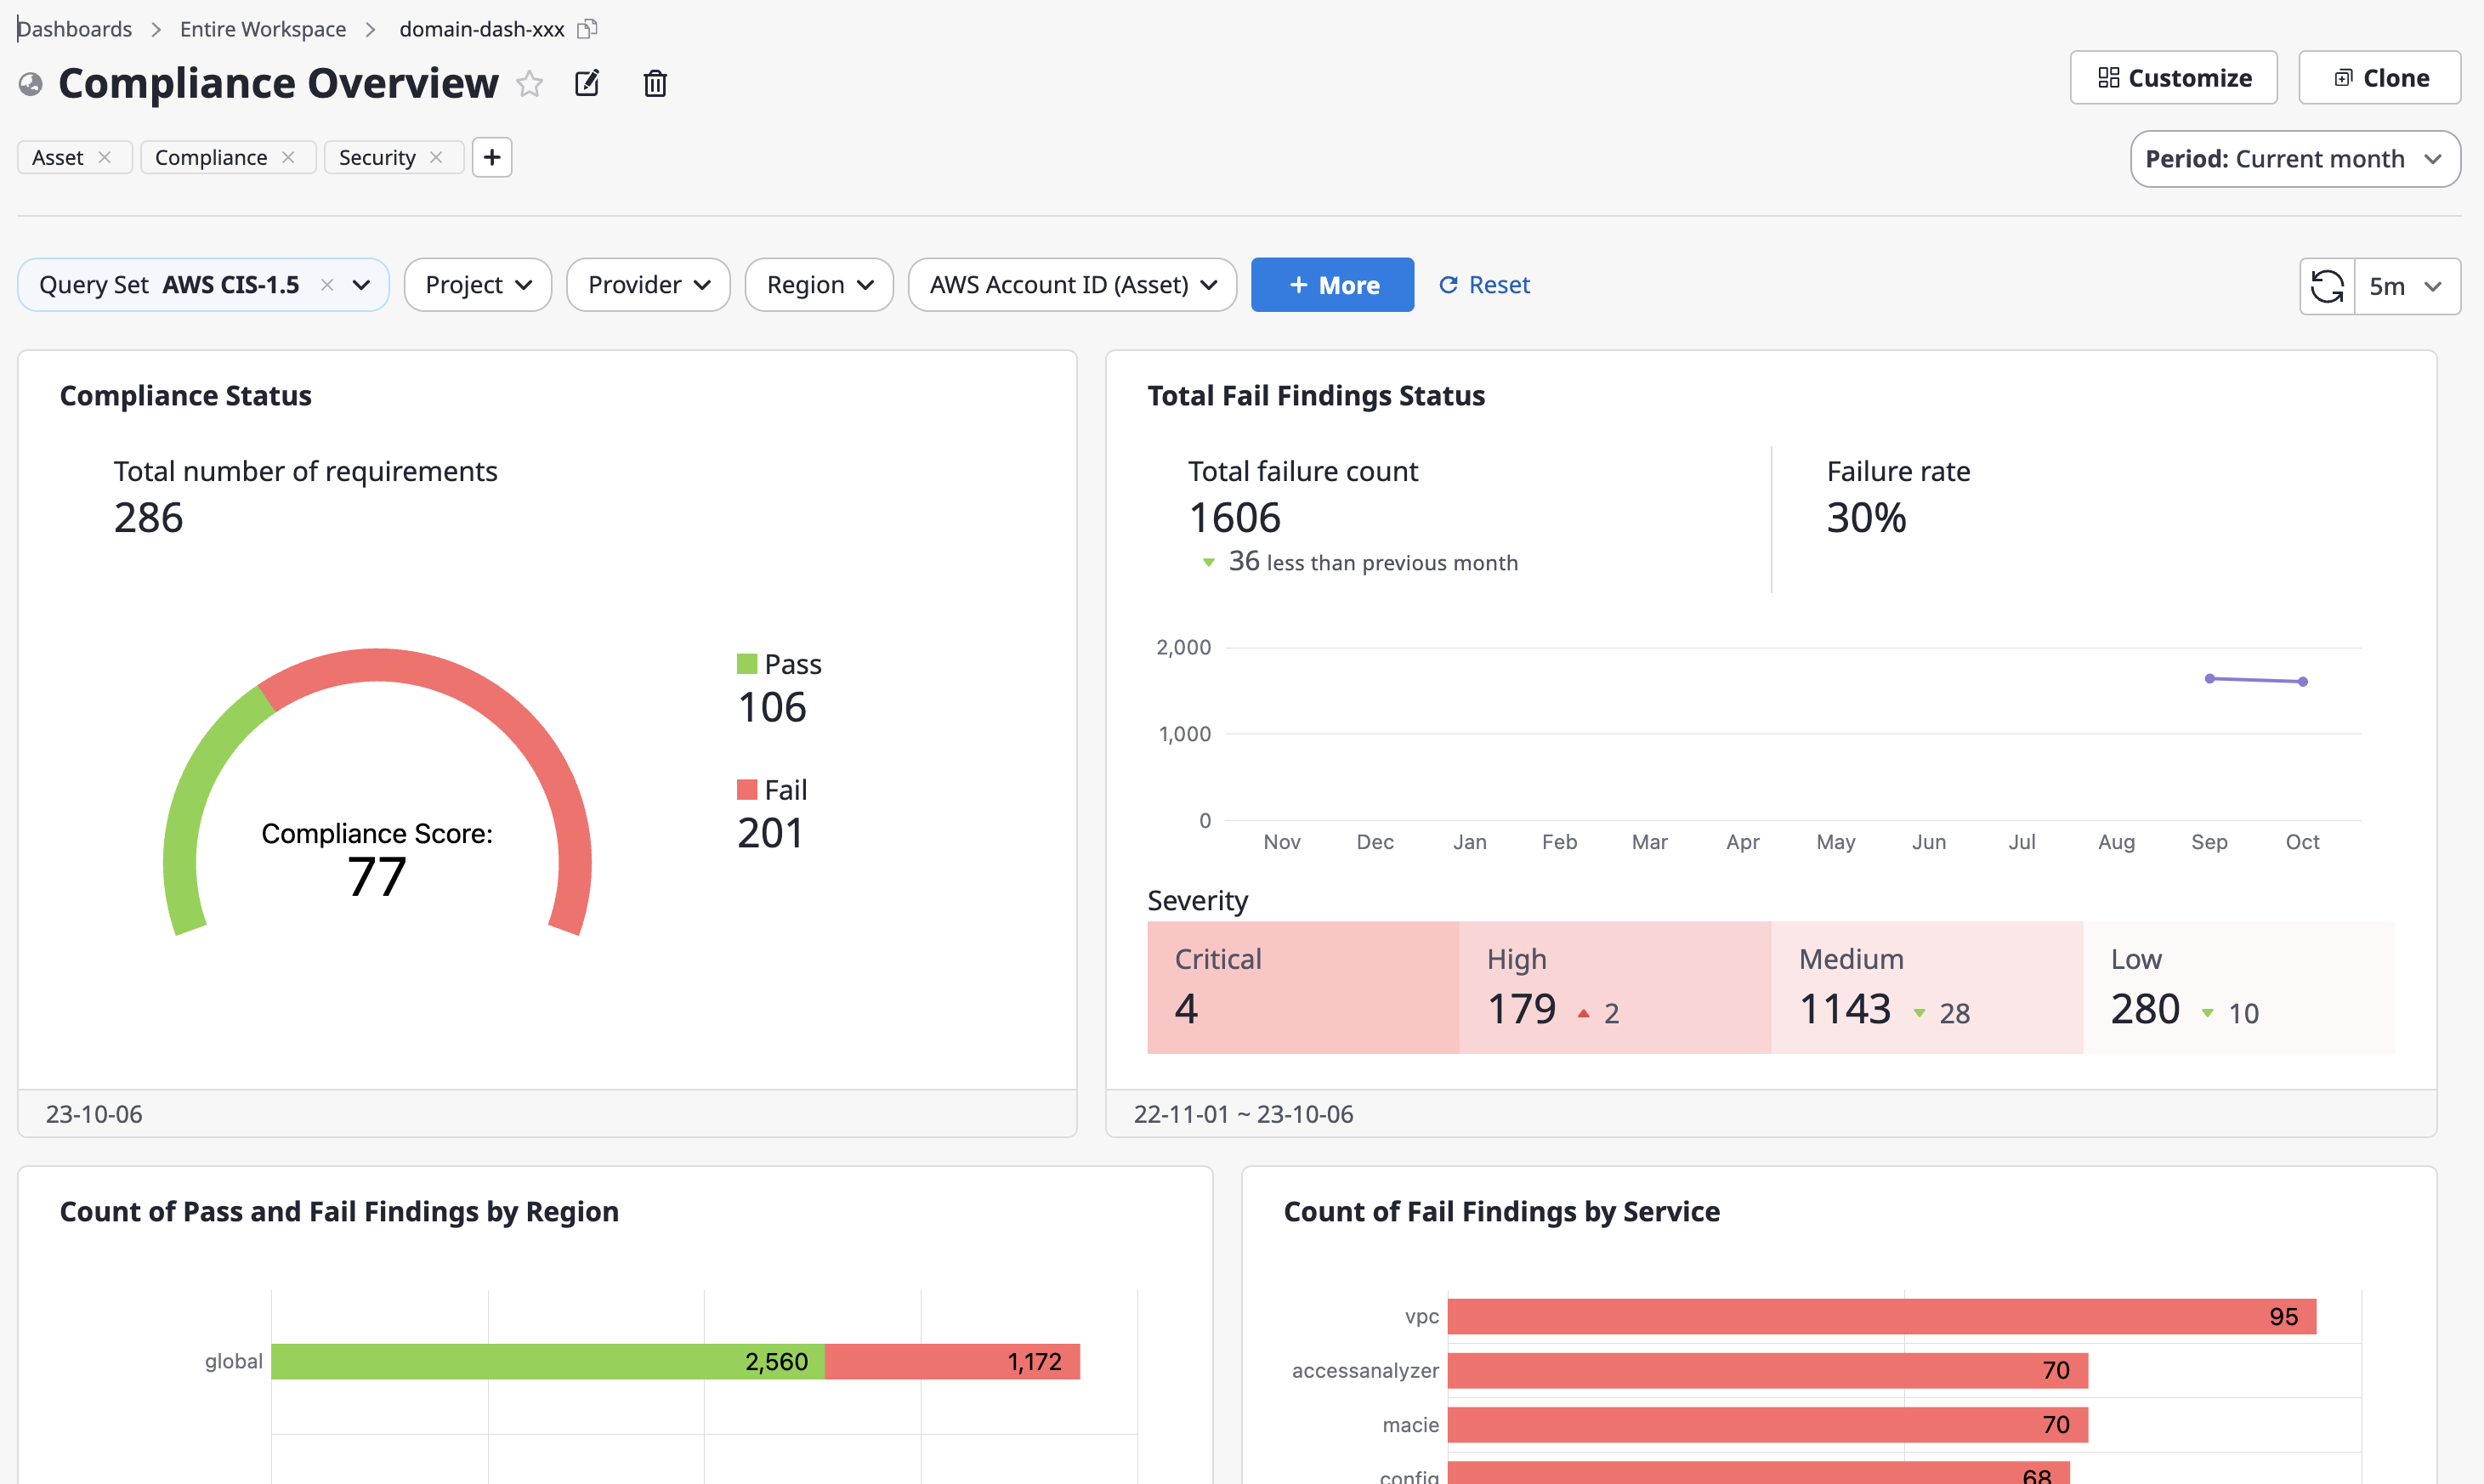
Compliance Overview
This is a dashboard that visualizes compliance configuration audit and monitoring results. One specific Data-Source must be selected.
2 - Create Dashboard
Creating a new dashboard
You can create a dashboard following the steps below.
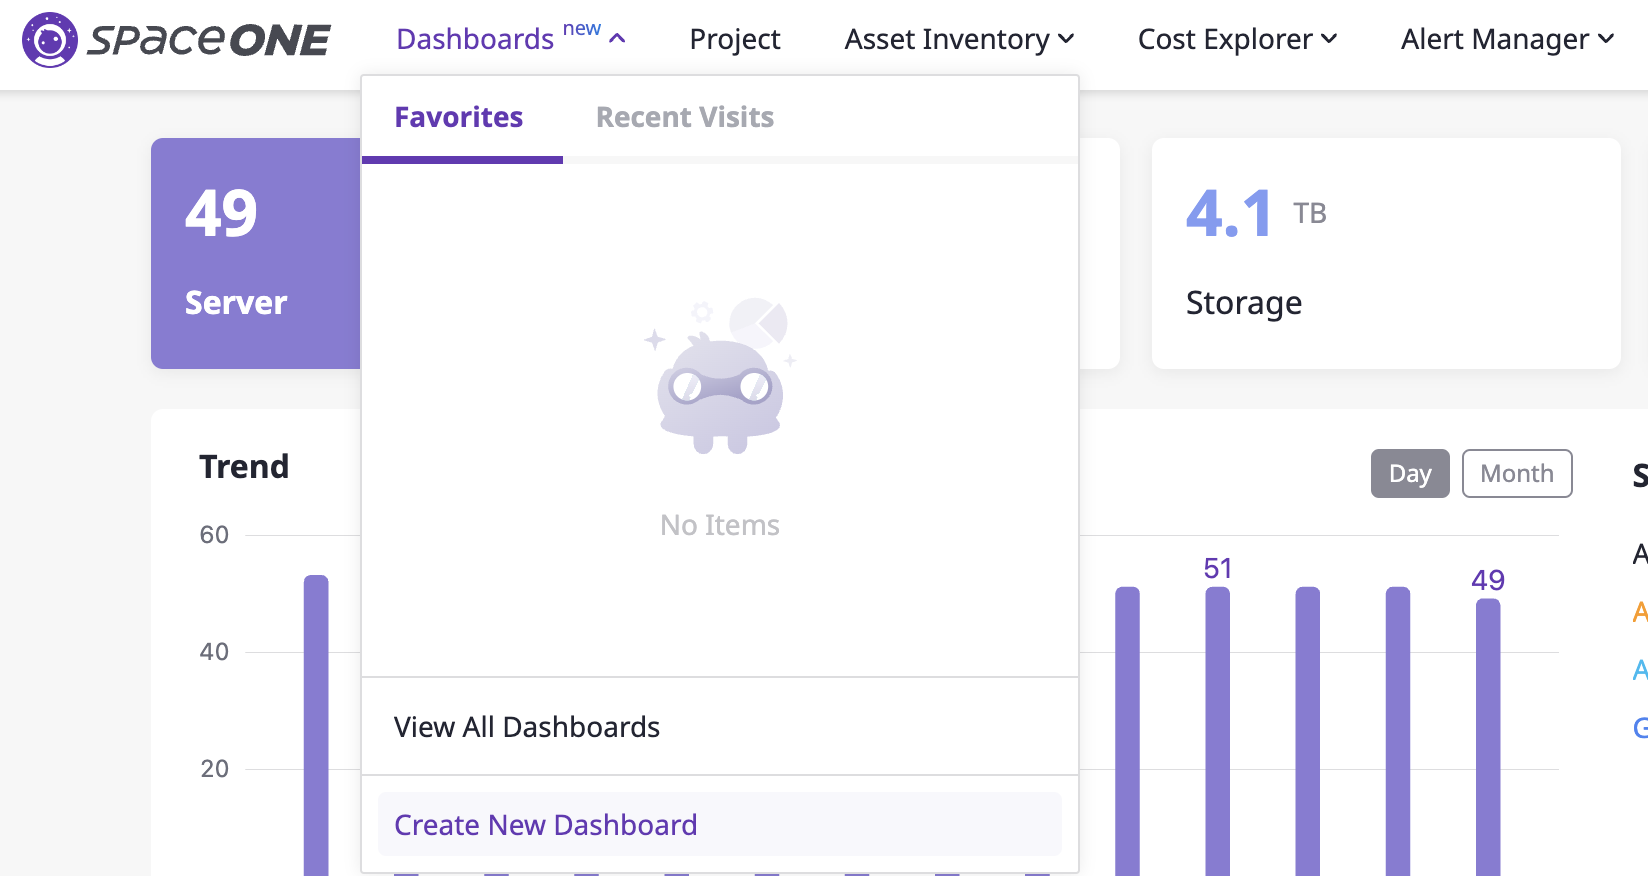
(1) To create a new dashboard, you can either click on [Dashboard > Create New Dashboard] in the top menu or click the [+] button at the top of the left-hand menu within the dashboard service to go to the creation page.

(2) On the "Create New Dashboard" page, select the dashboard scope and choose whether it should be public or not.
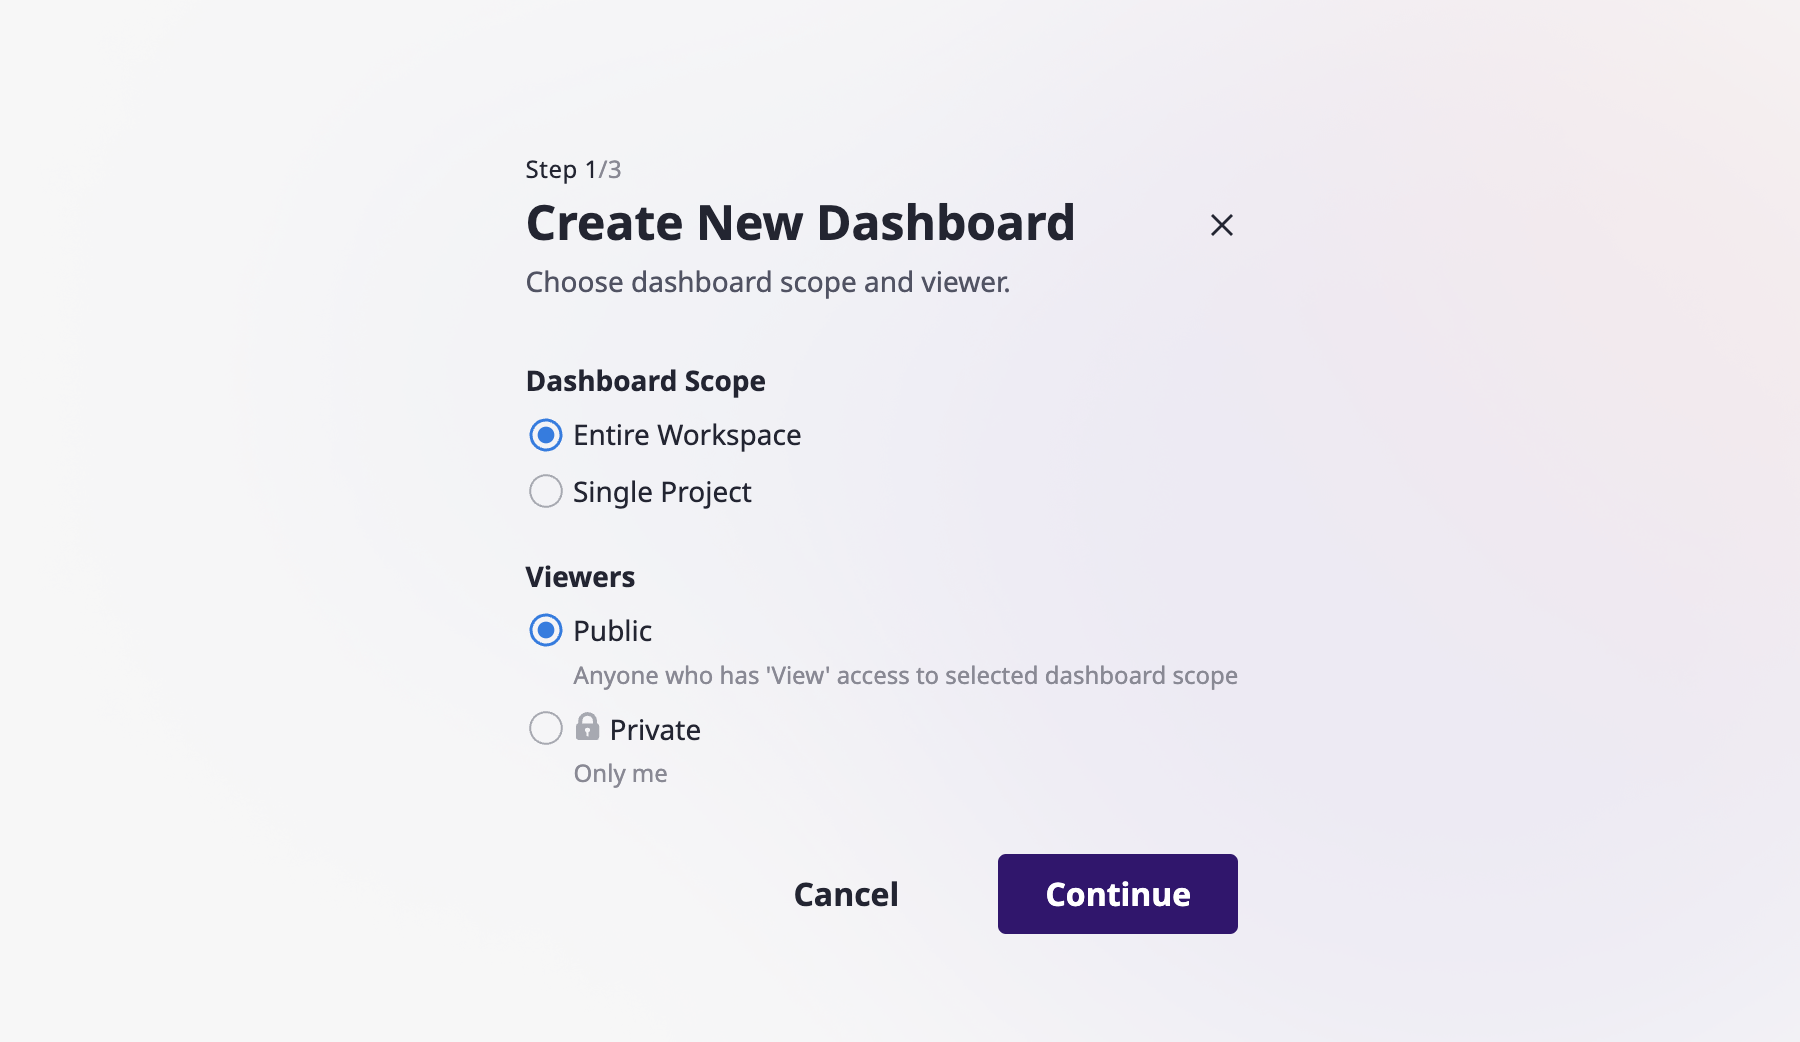
- Entire Workspace : The data for the entire workspace's projects will be displayed.
- Single Project : The dashboard will be configured using only the data from a chosen project.
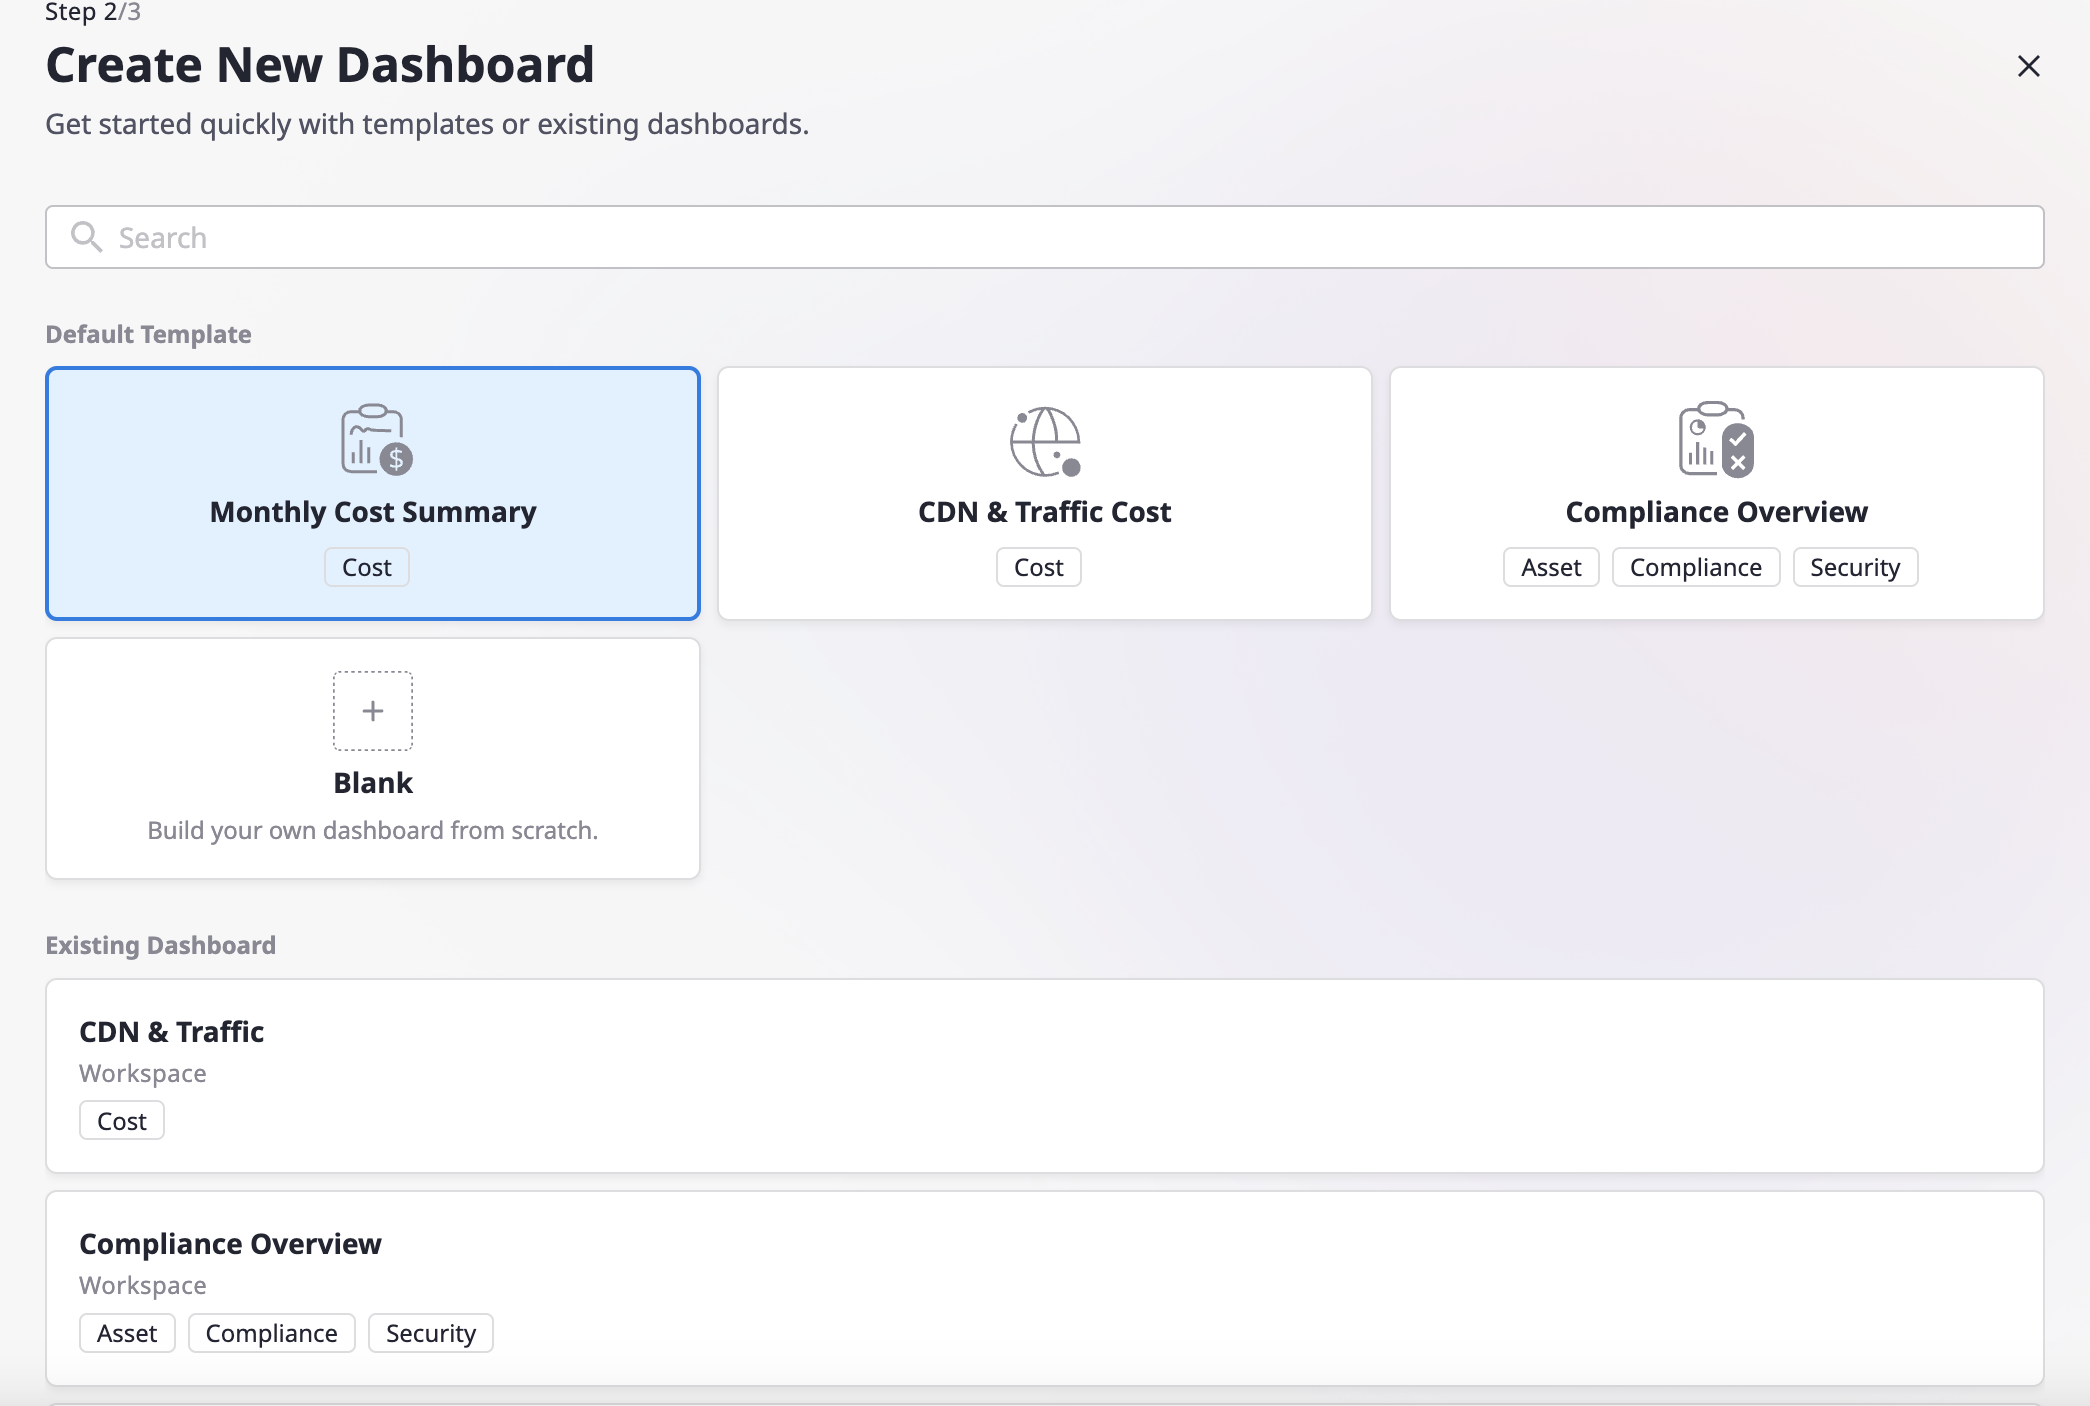
(3) You can select from the default templates provided by Cloudforet or choose to duplicate an existing dashboard. After selecting your preferred options, click the [Continue] button.
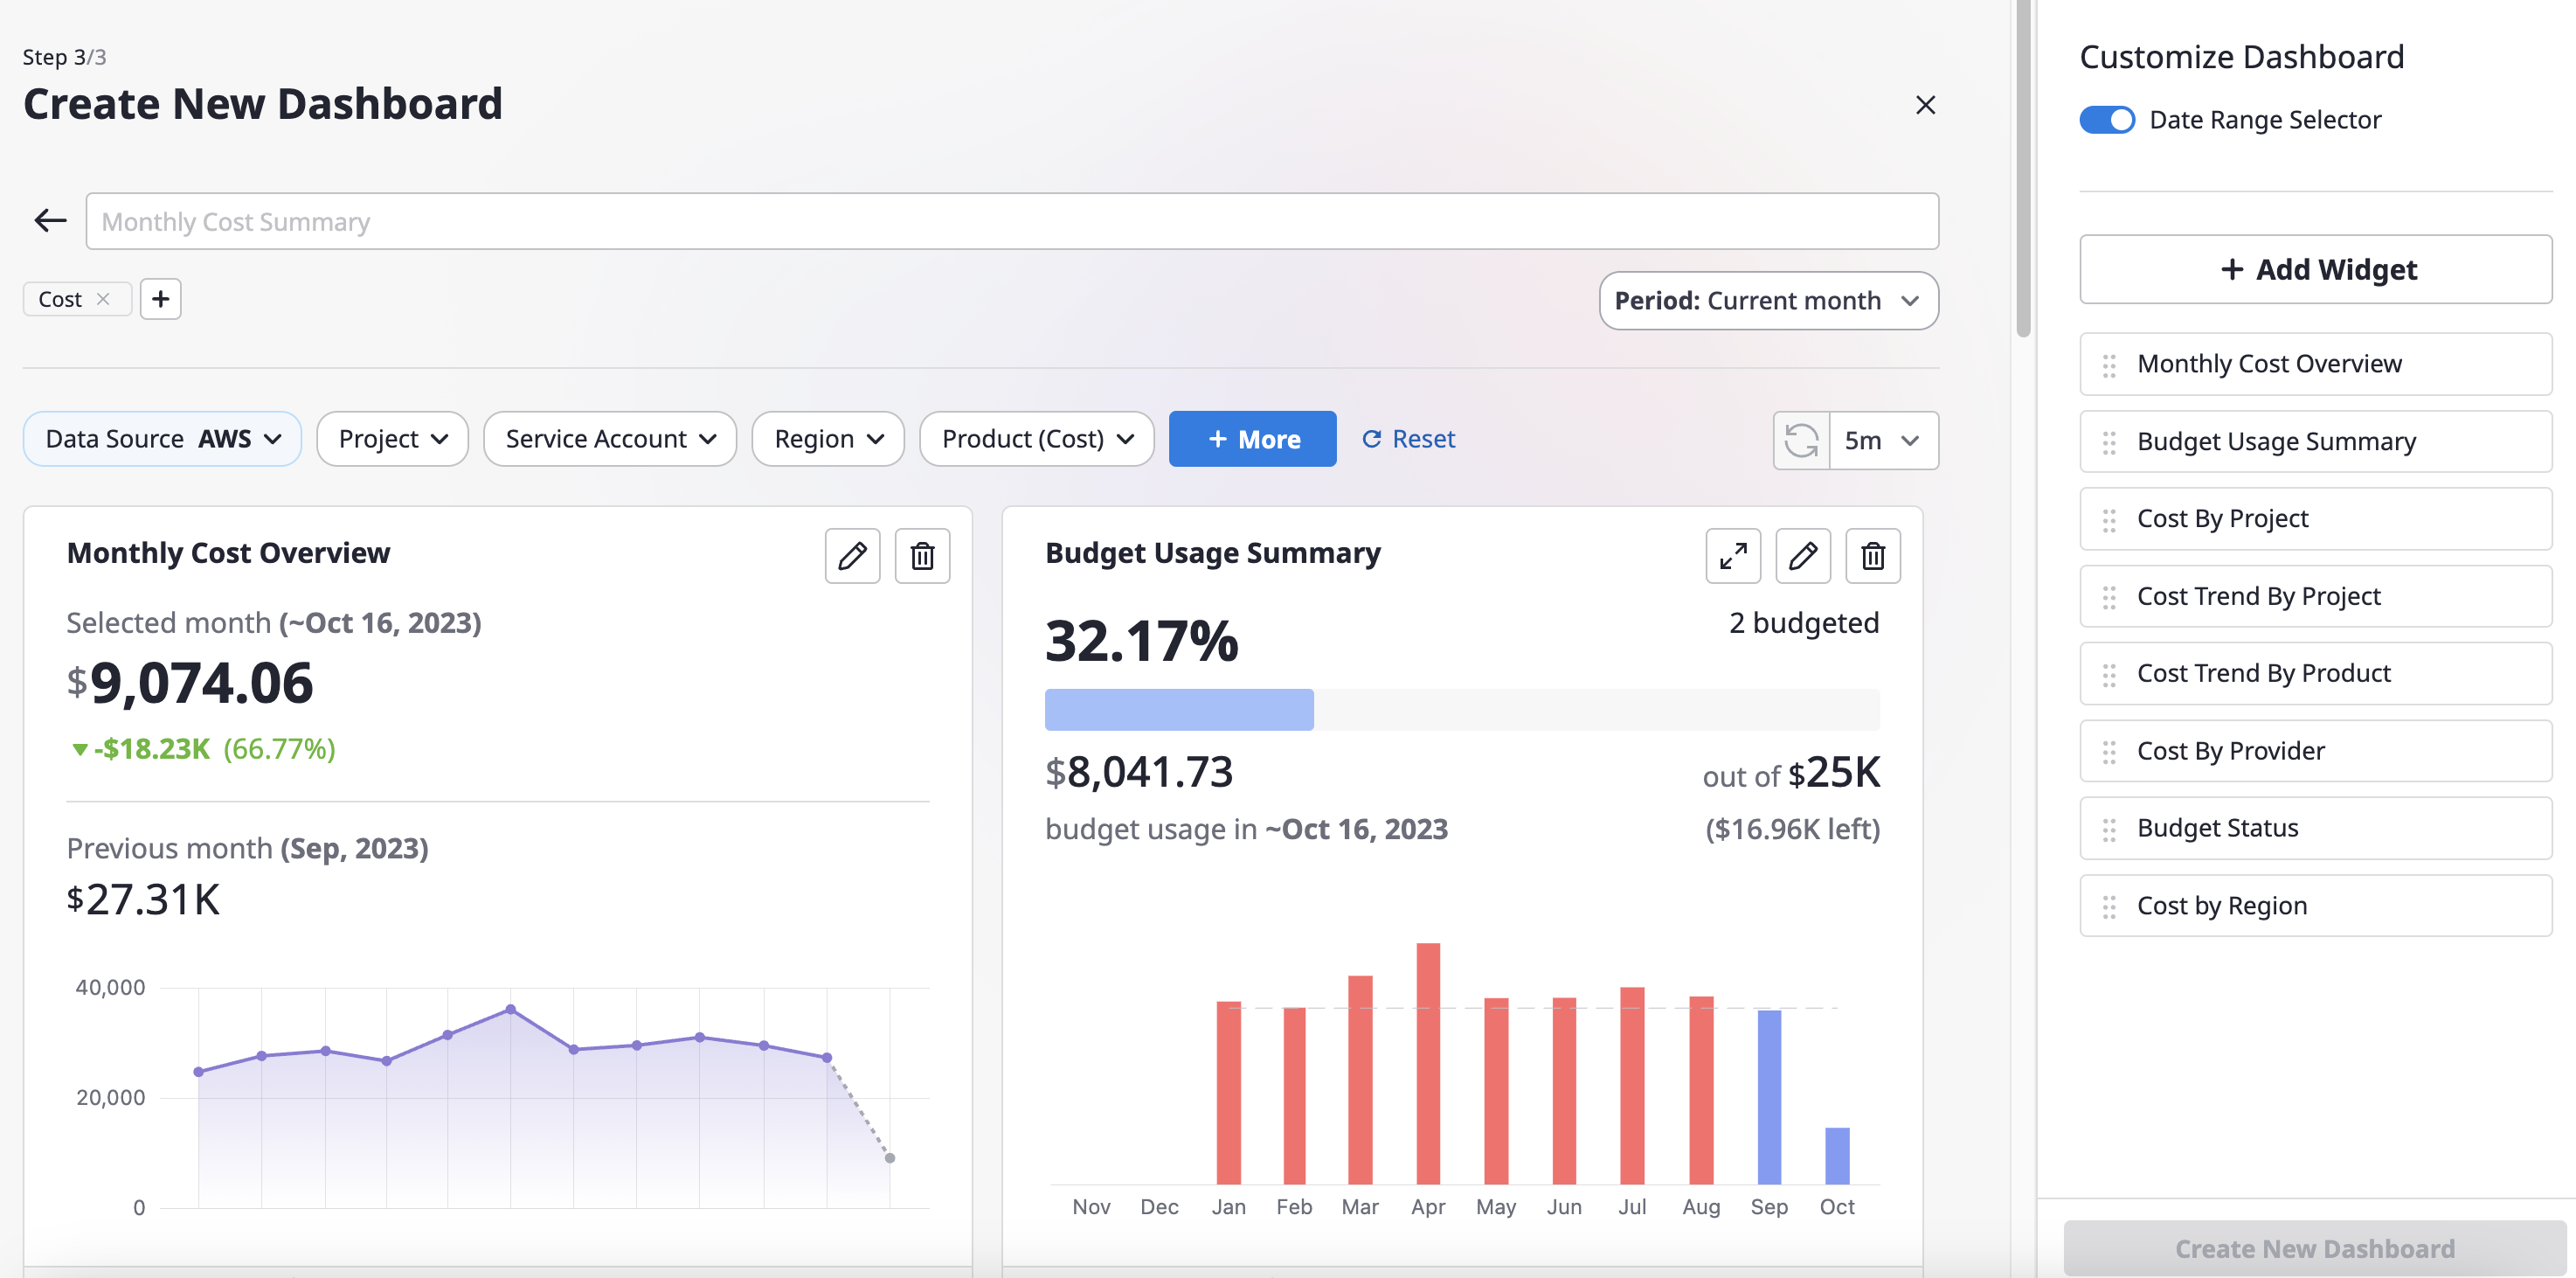
(4) After entering the dashboard name, you can complete creating the dashboard using the provided widgets. For detailed editing instructions, refer to here.
(5) The created dashboard can be found on the [View All Dashboards] page, categorized based on [viewers] and [scope].
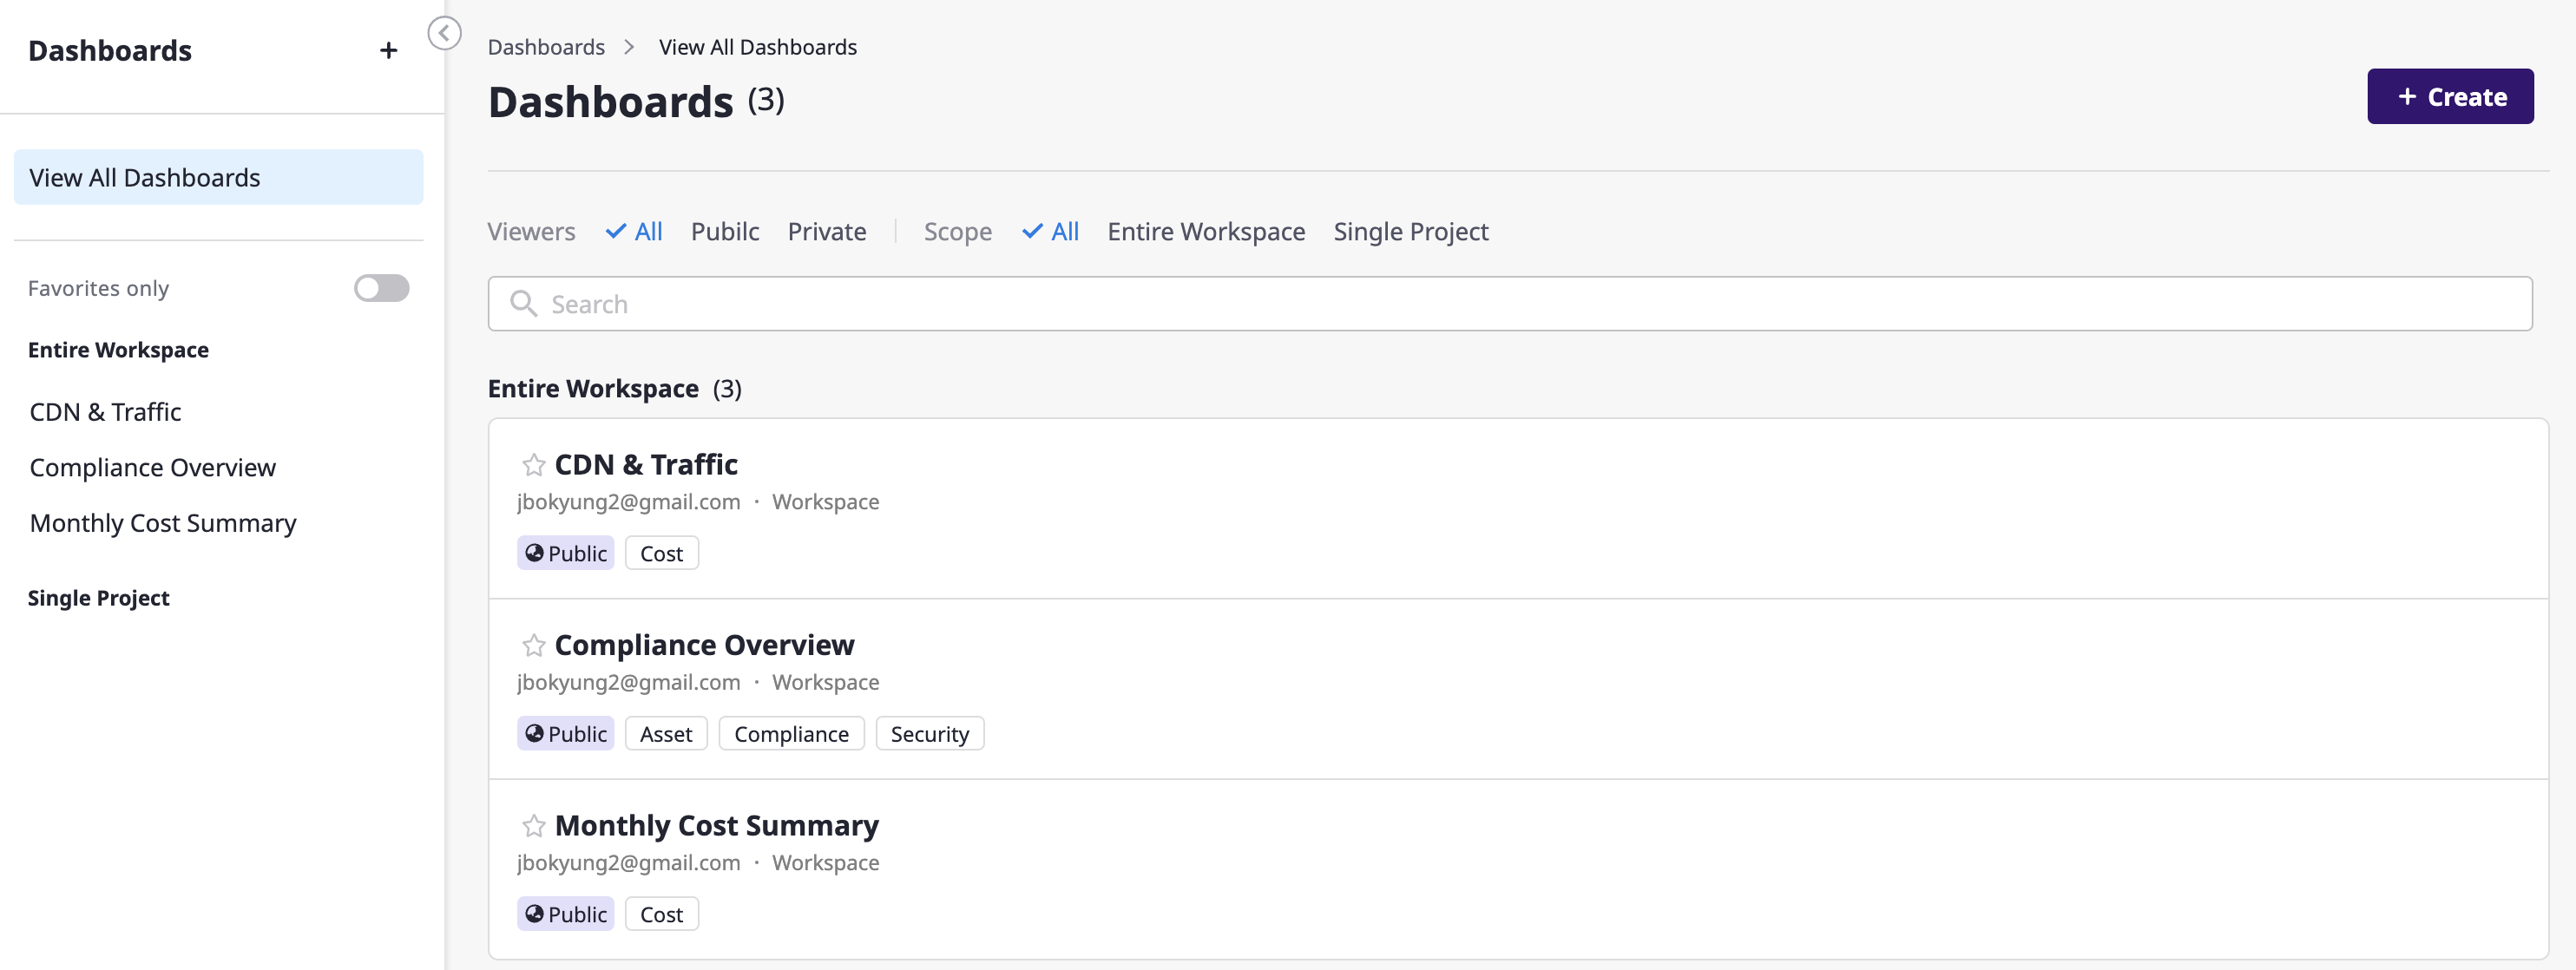
To review the created dashboard and make quick adjustments, please refer to here.
3 - Customize Dashboard
Customizing your dashboard
Switch to 'Customize' mode
Clicking the [Customize] button on the right side of a dashboard page will take you to the dashboard editing page.
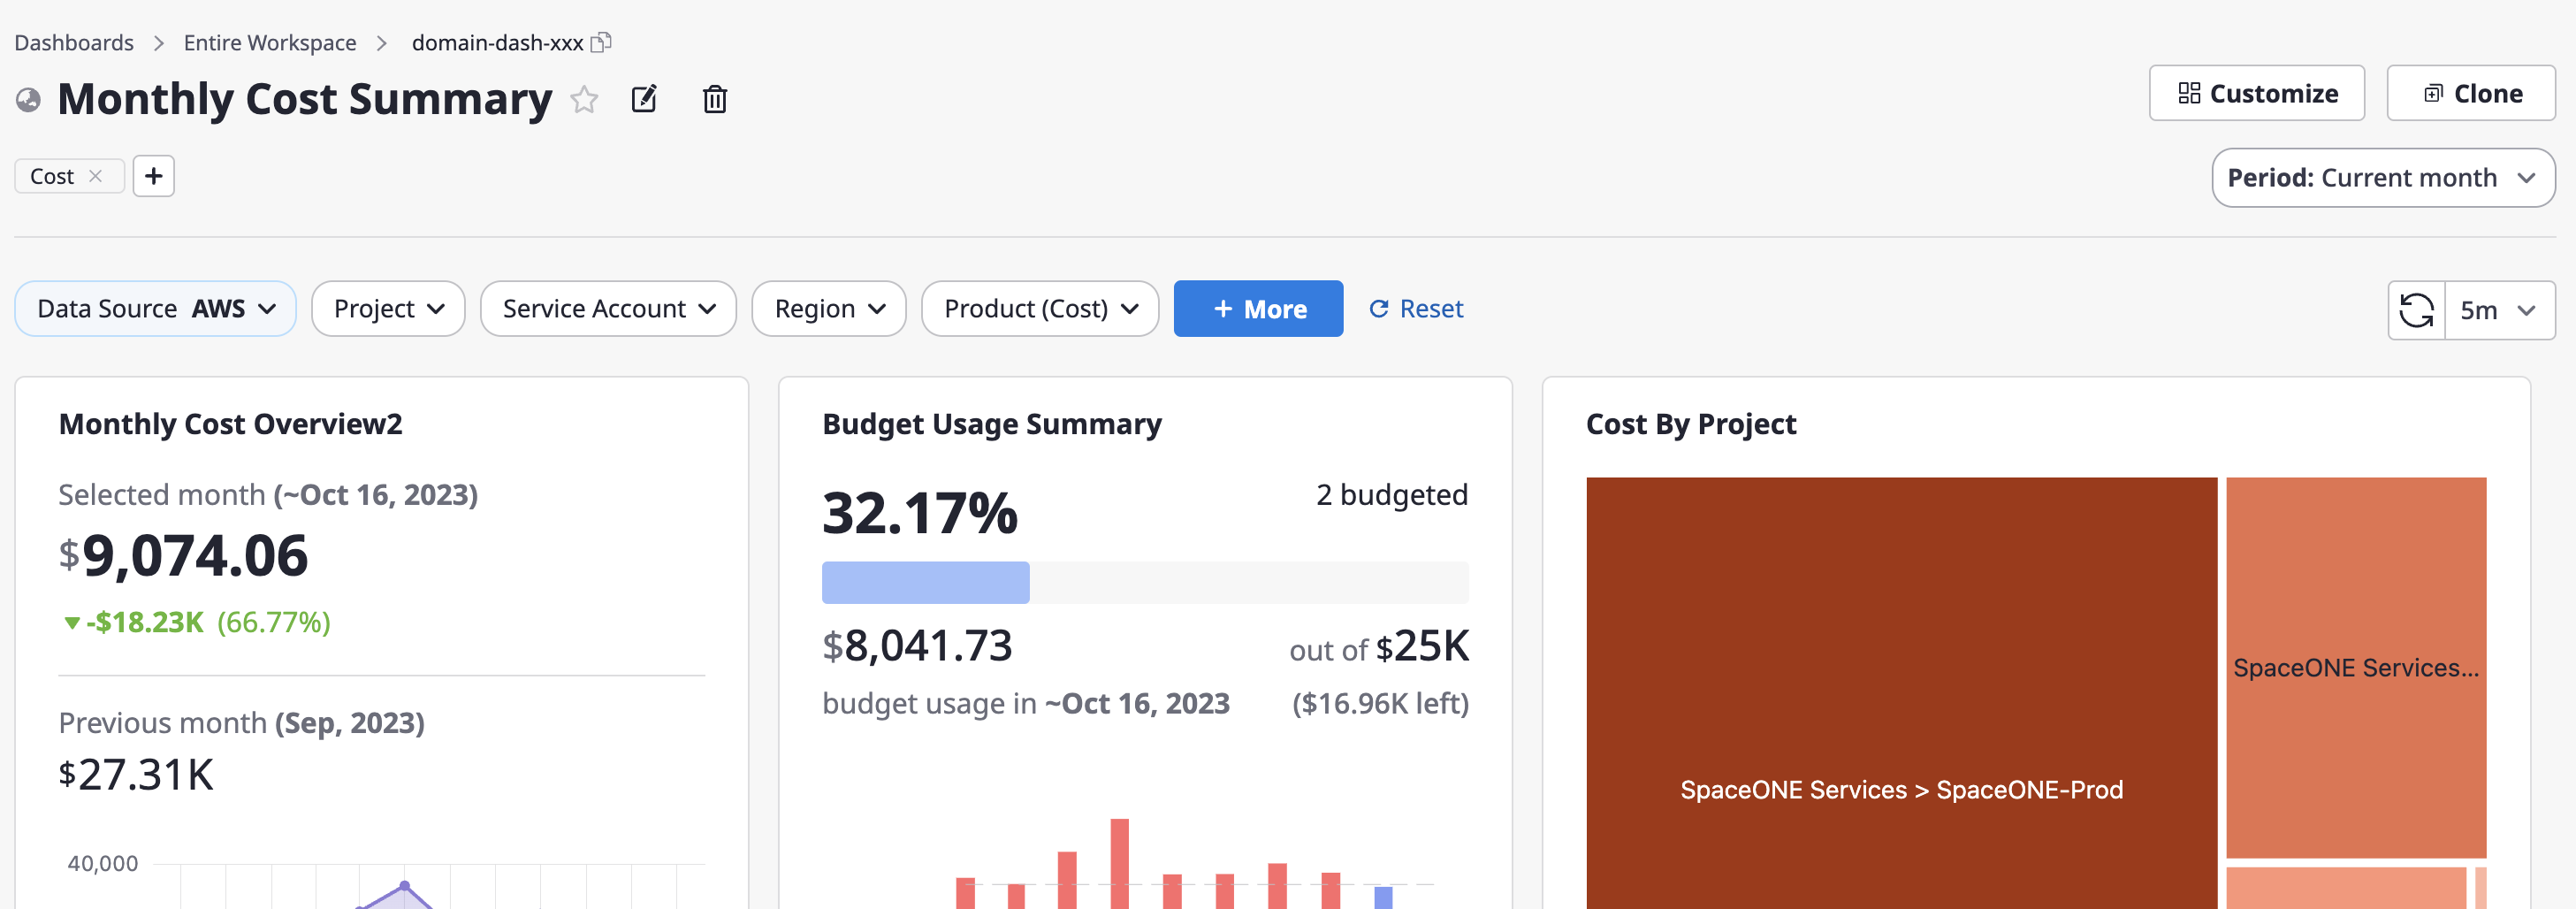
Rename the dashboard
You can click the [Edit] icon button next to the dashboard title to make changes.

Manage labels
You can add or remove labels just below the dashboard title at the top. Labels are used to categorize and differentiate dashboard-related categories and features, making them useful for dashboard searches.

Apply a period range
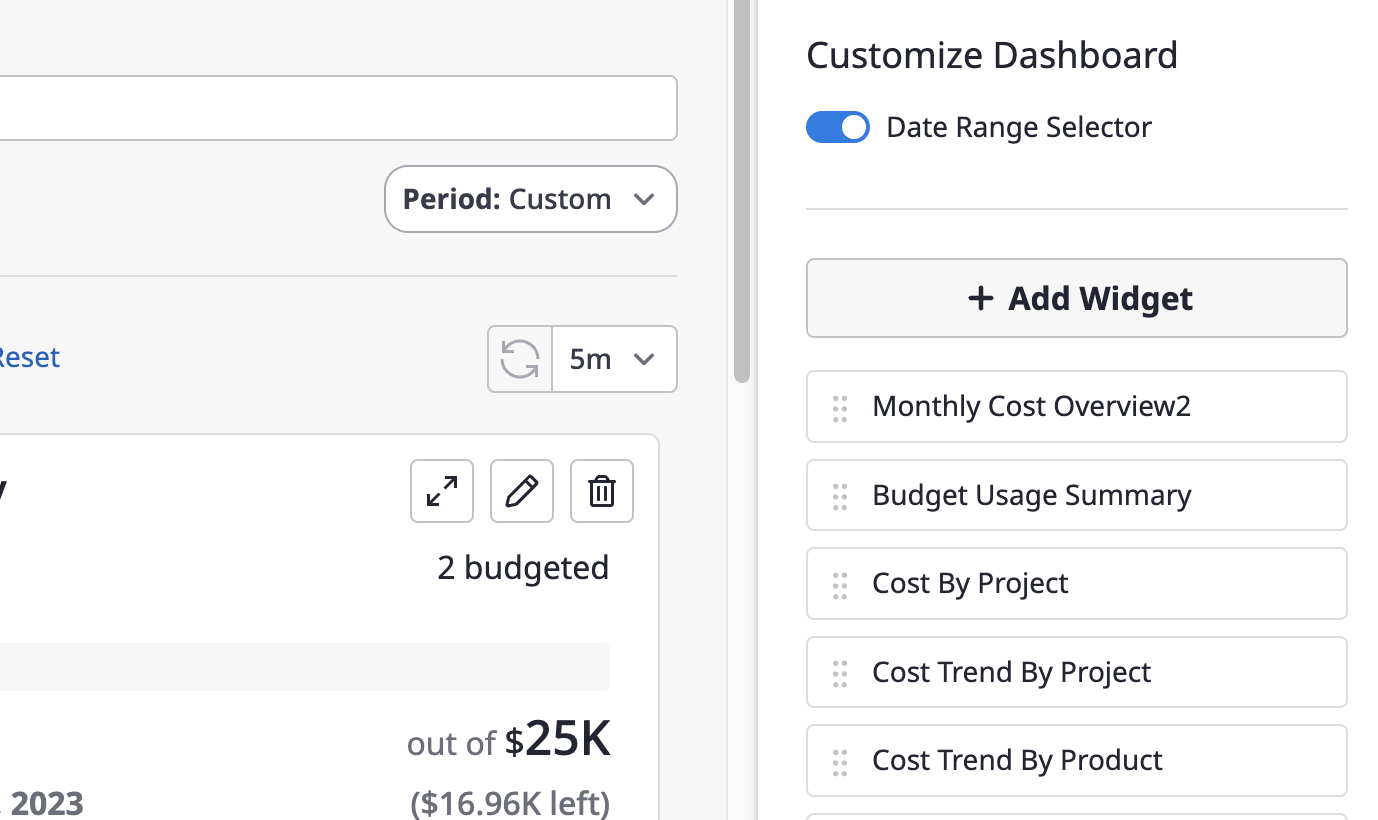
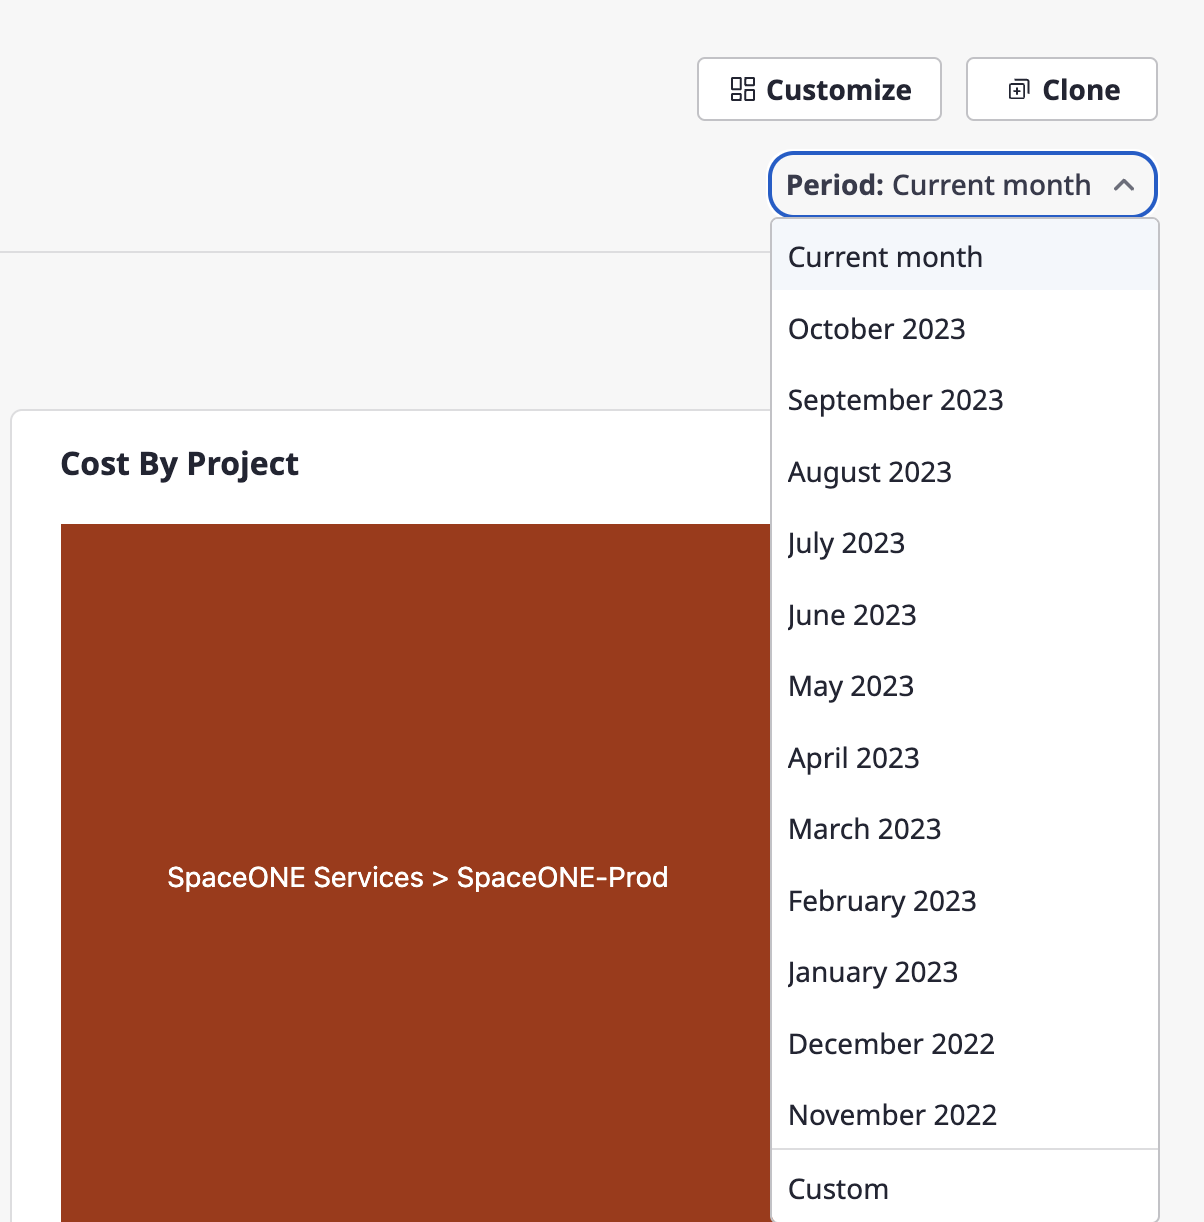
(1) When you activate the [Date Range Selector] option from the right side panel, a dropdown button for setting the period will be displayed on the dashboard.
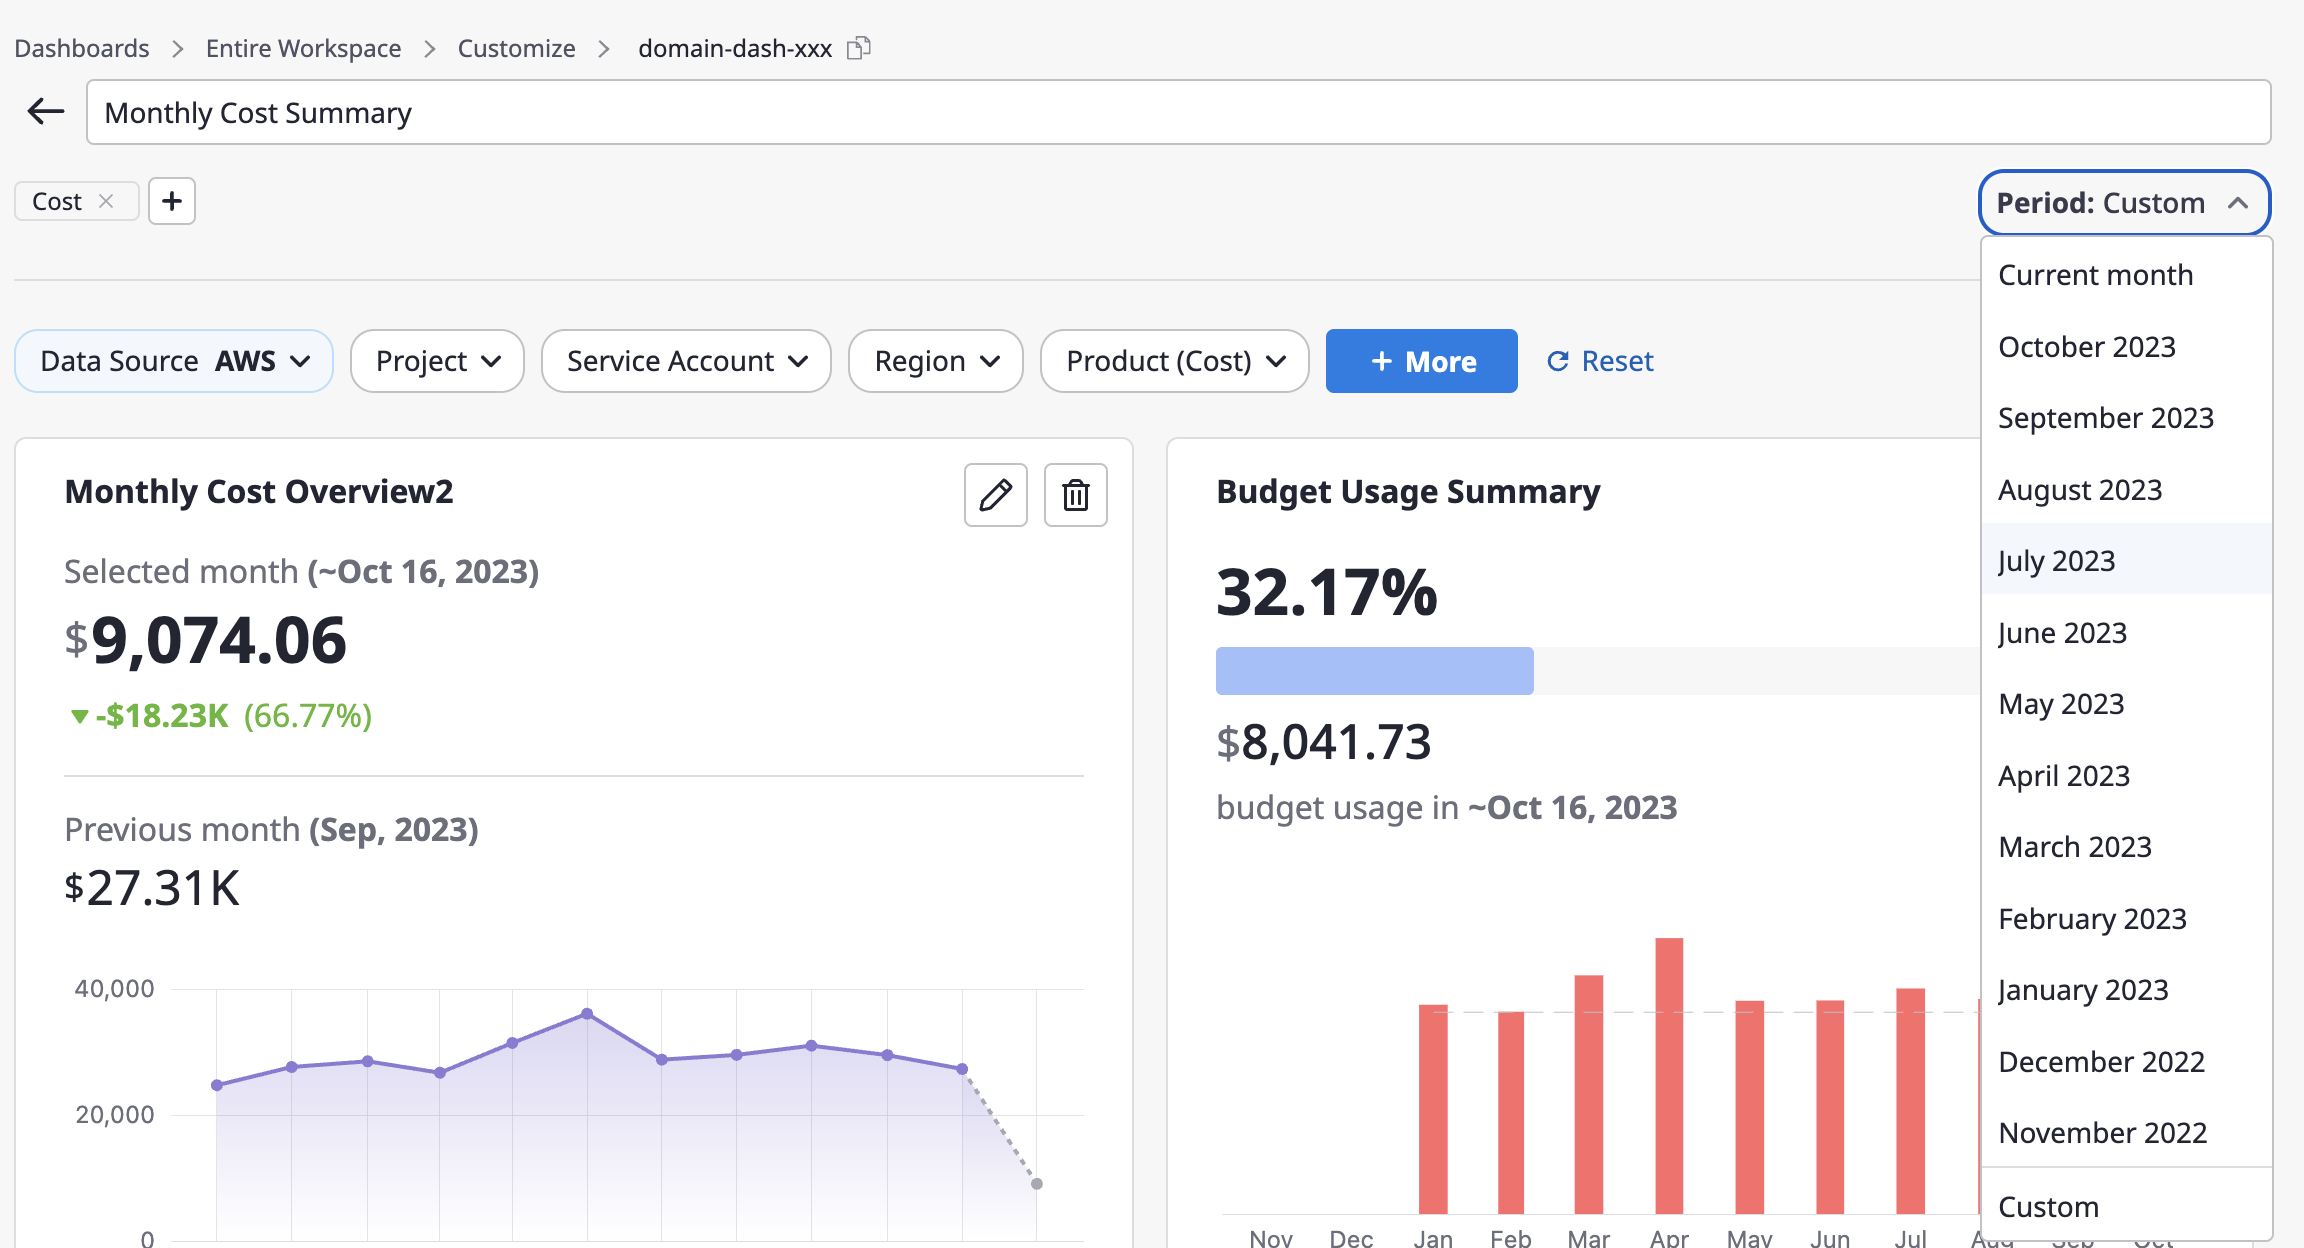
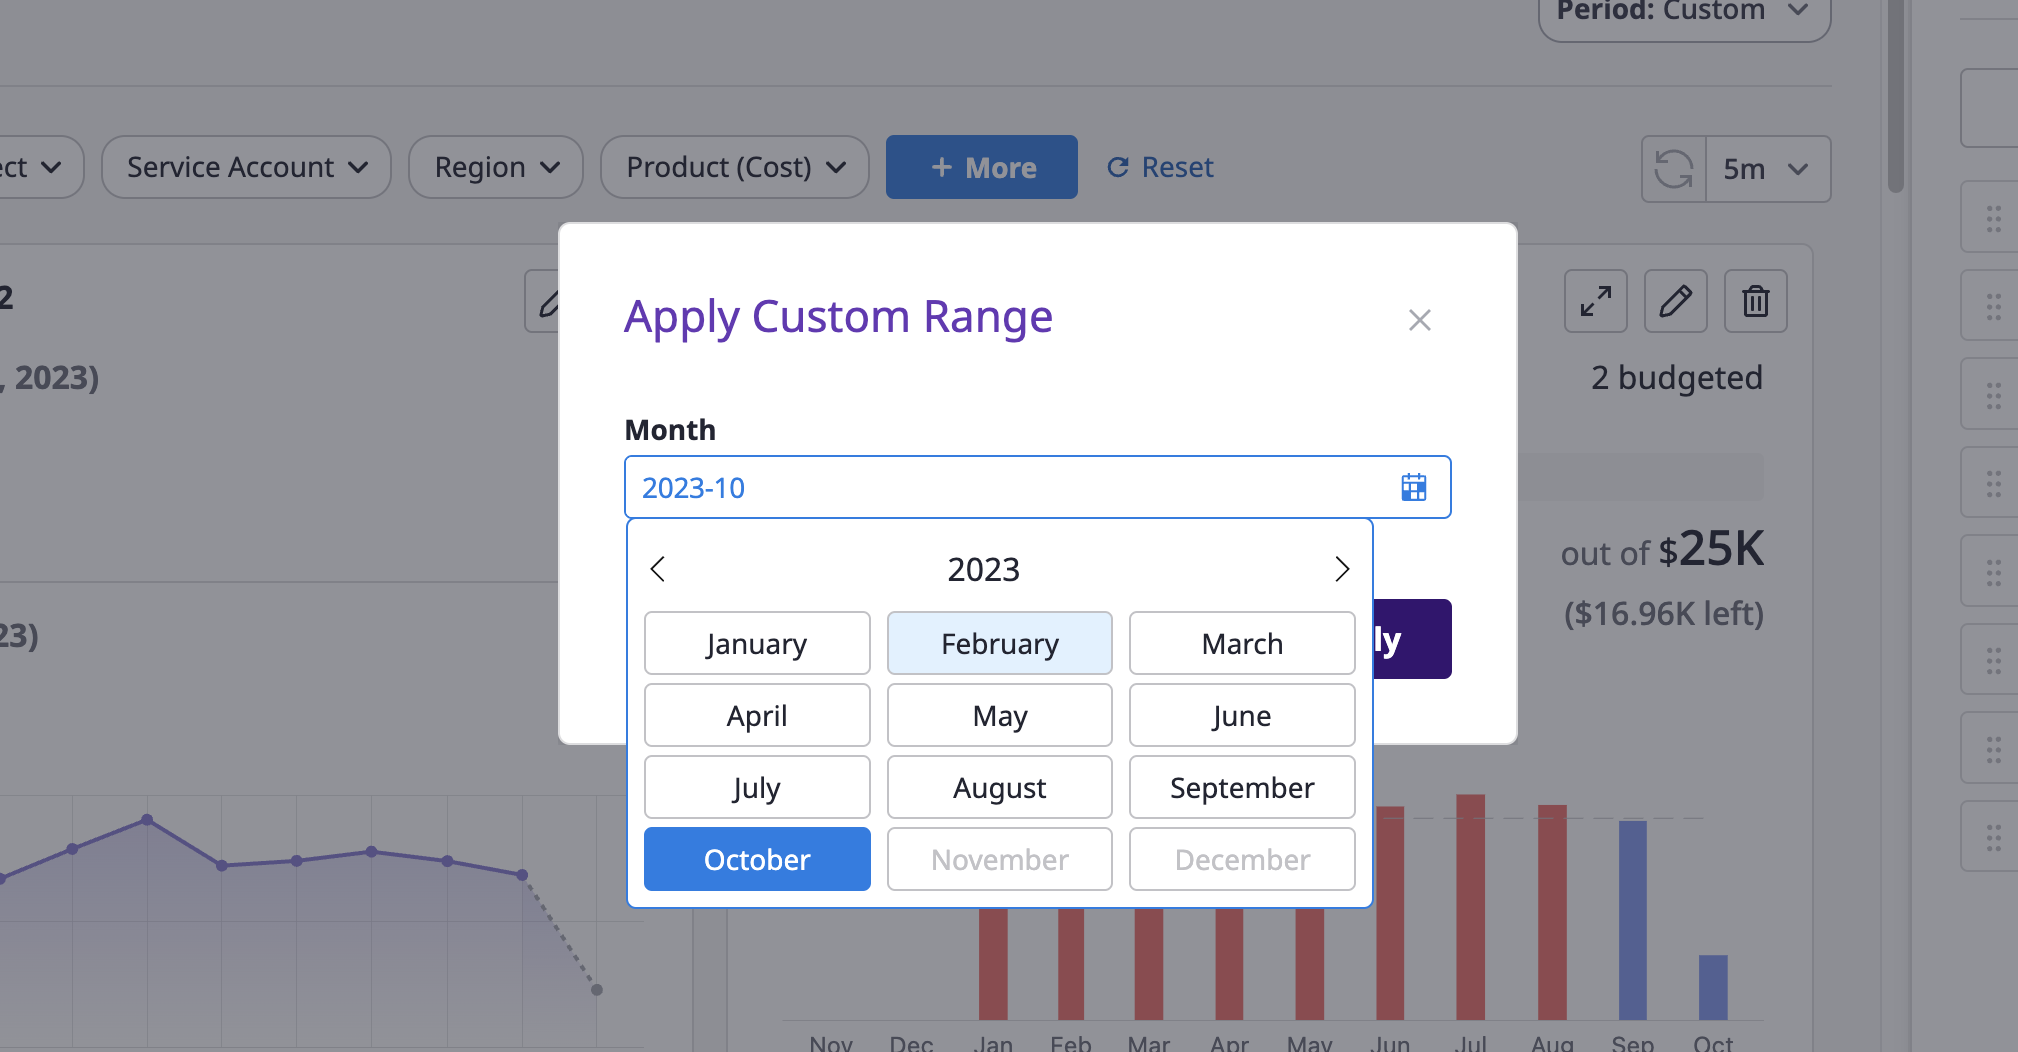
(2) You can select a specific month from the drop-down or choose a specific month within the last 3 years using the [Custom] menu.
Configure auto data refresh
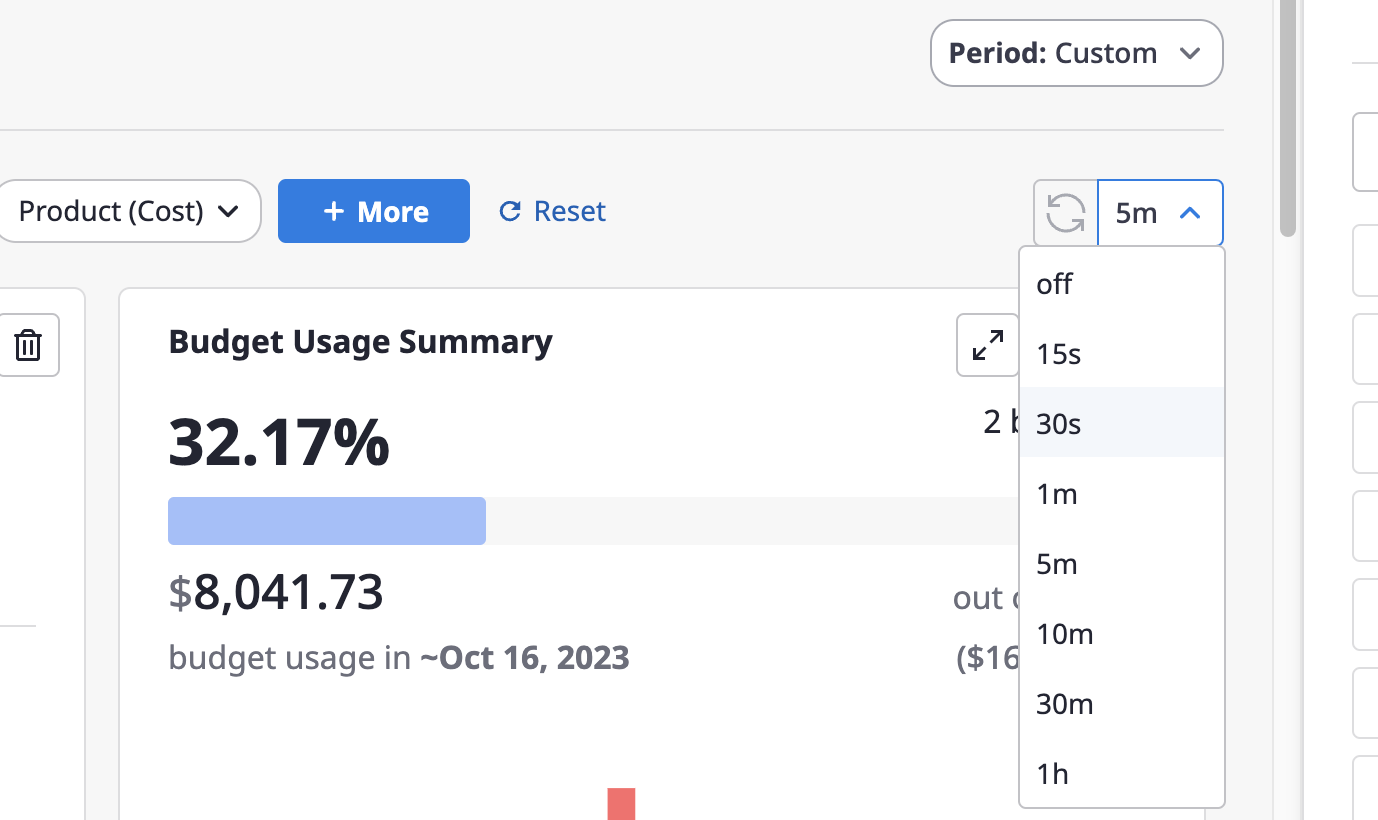
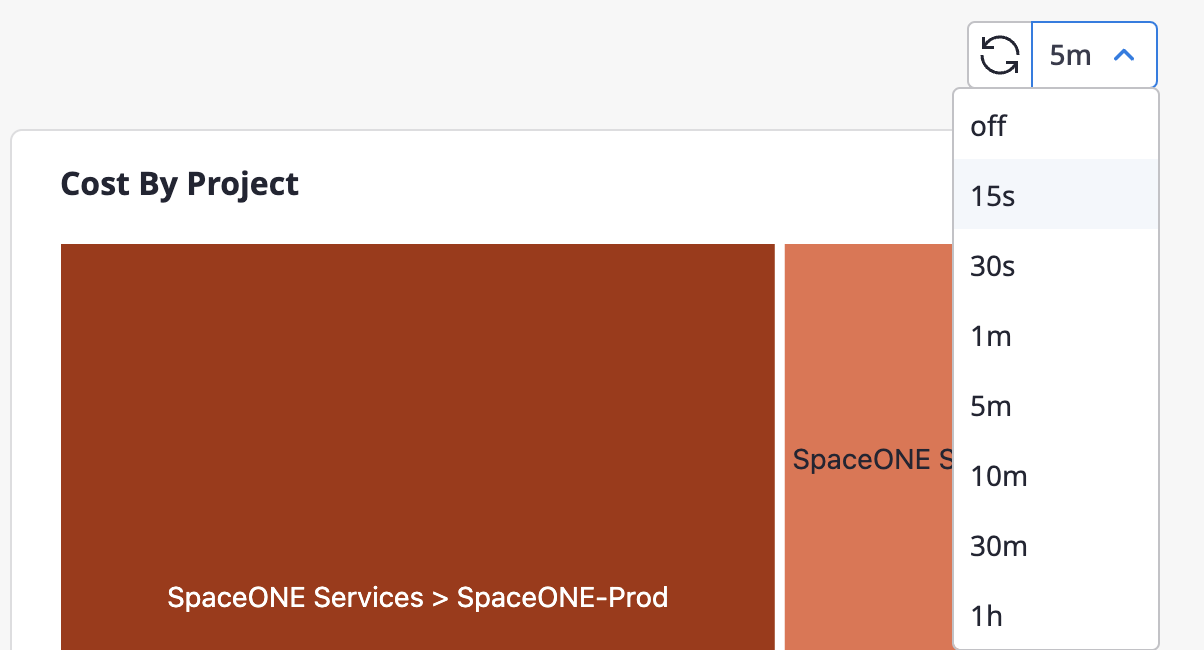
You can choose the data refresh interval from the [Refresh] dropdown in the upper right corner of the dashboard.
Add widgets
(1) Click the [+ Add Widget] button on the right-hand dashboard editing page.
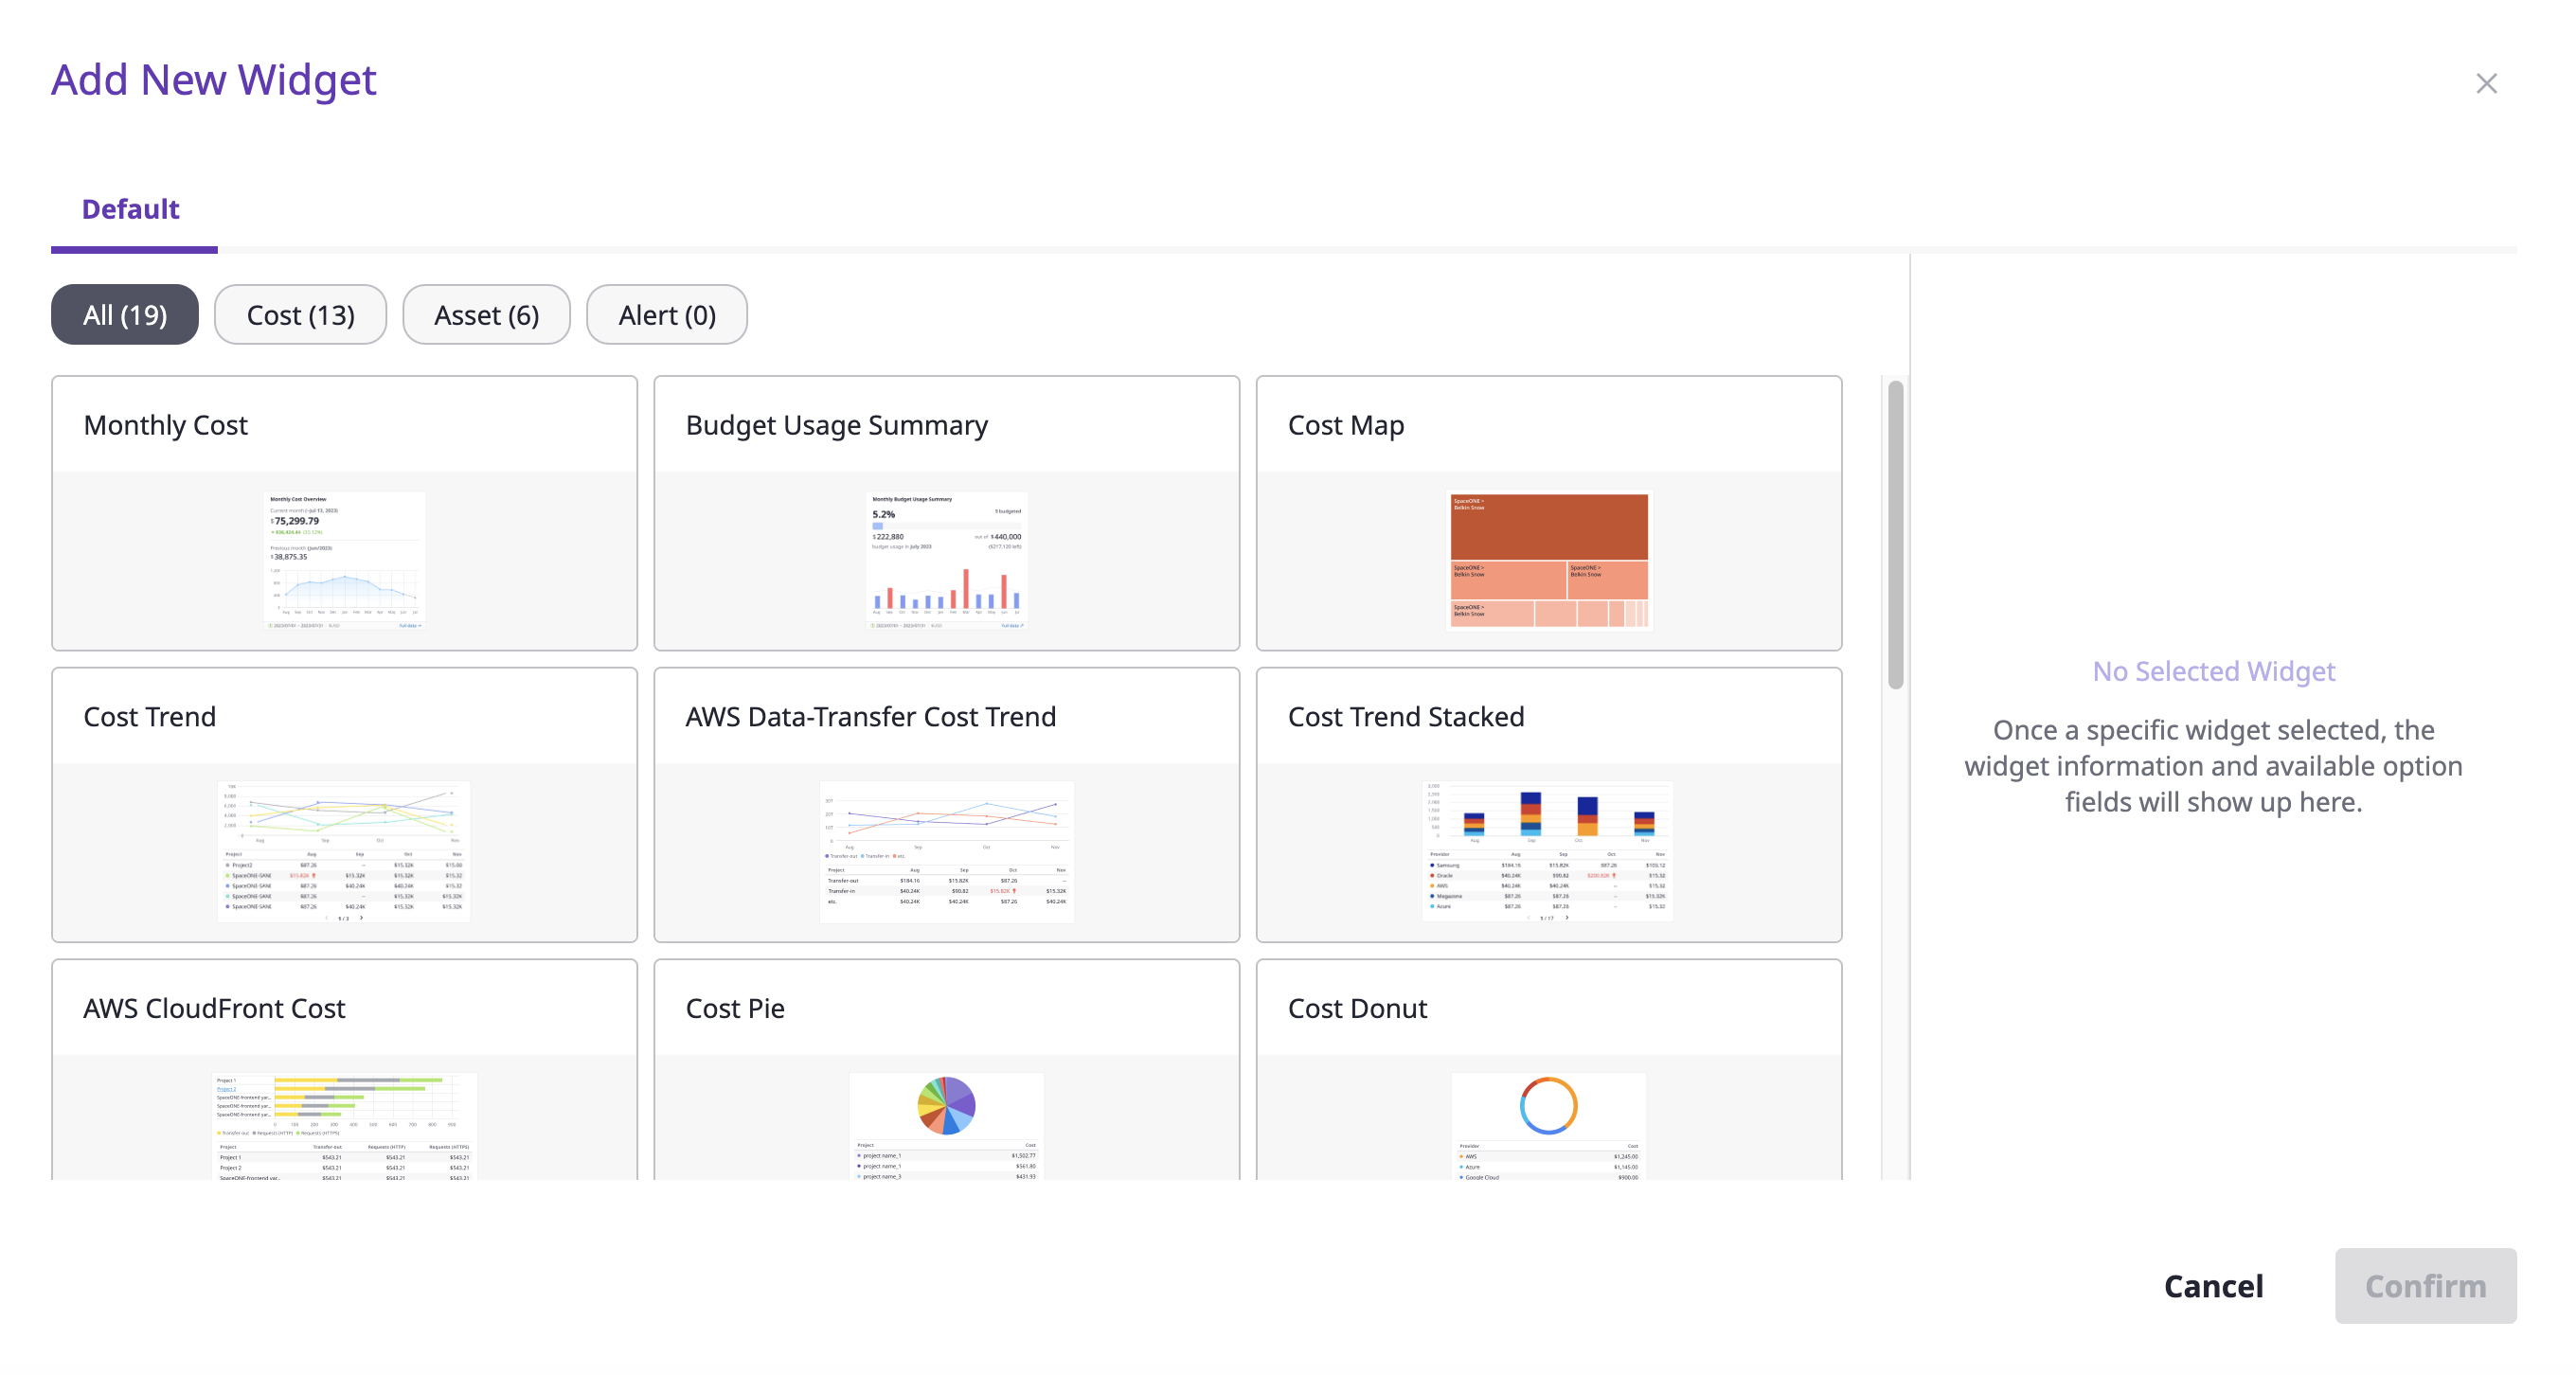
(2) Select a specific widget from the list on the left and add it.
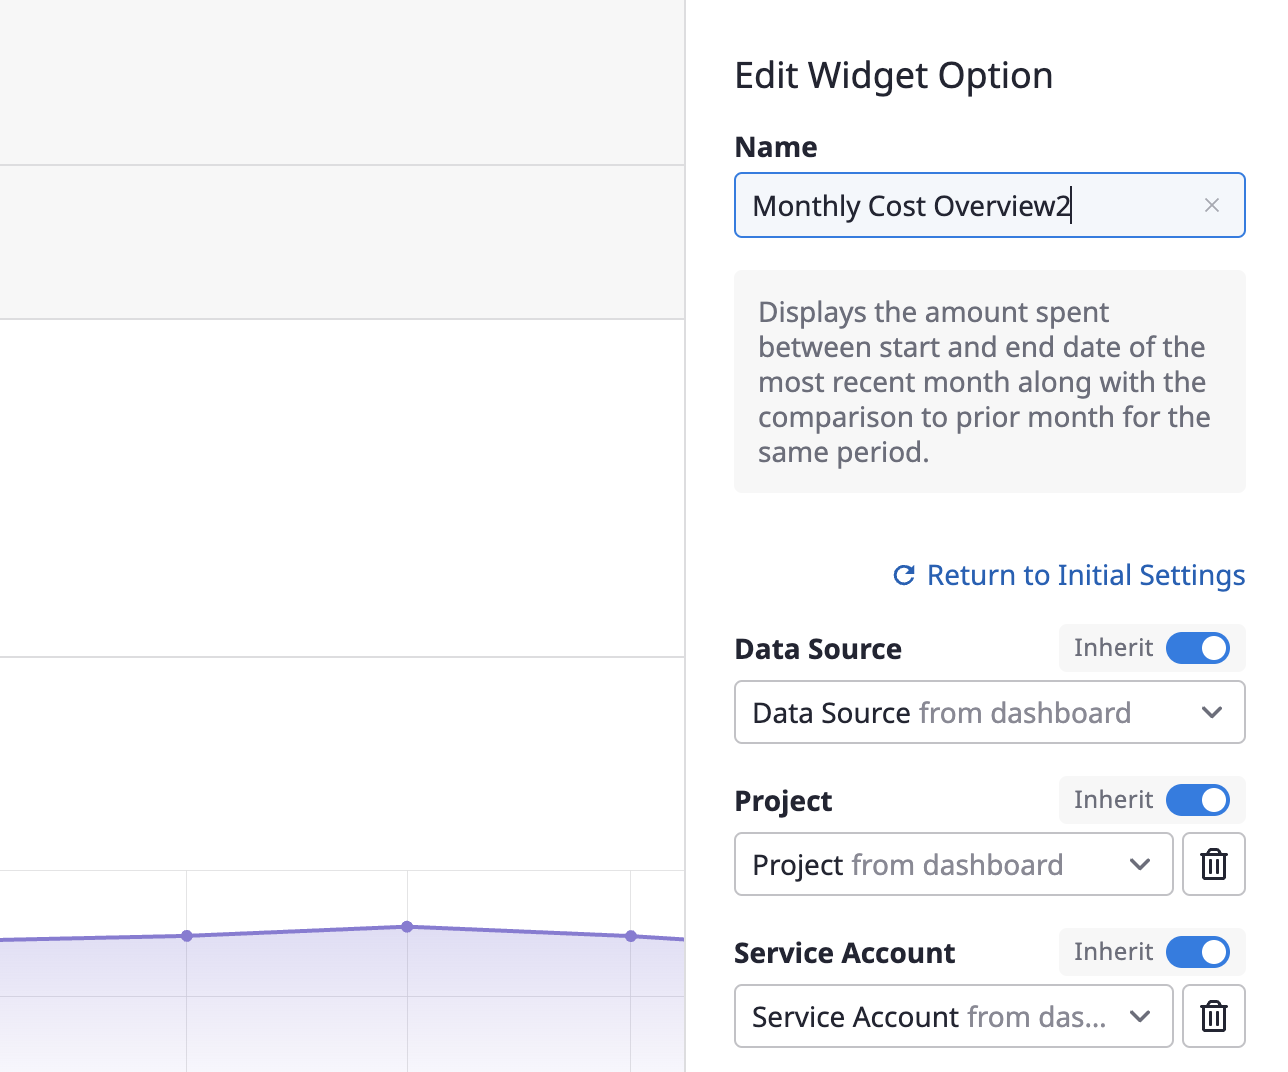
(2-2) If you have selected a specific widget, you can enter the [Name] and set the detailed options.
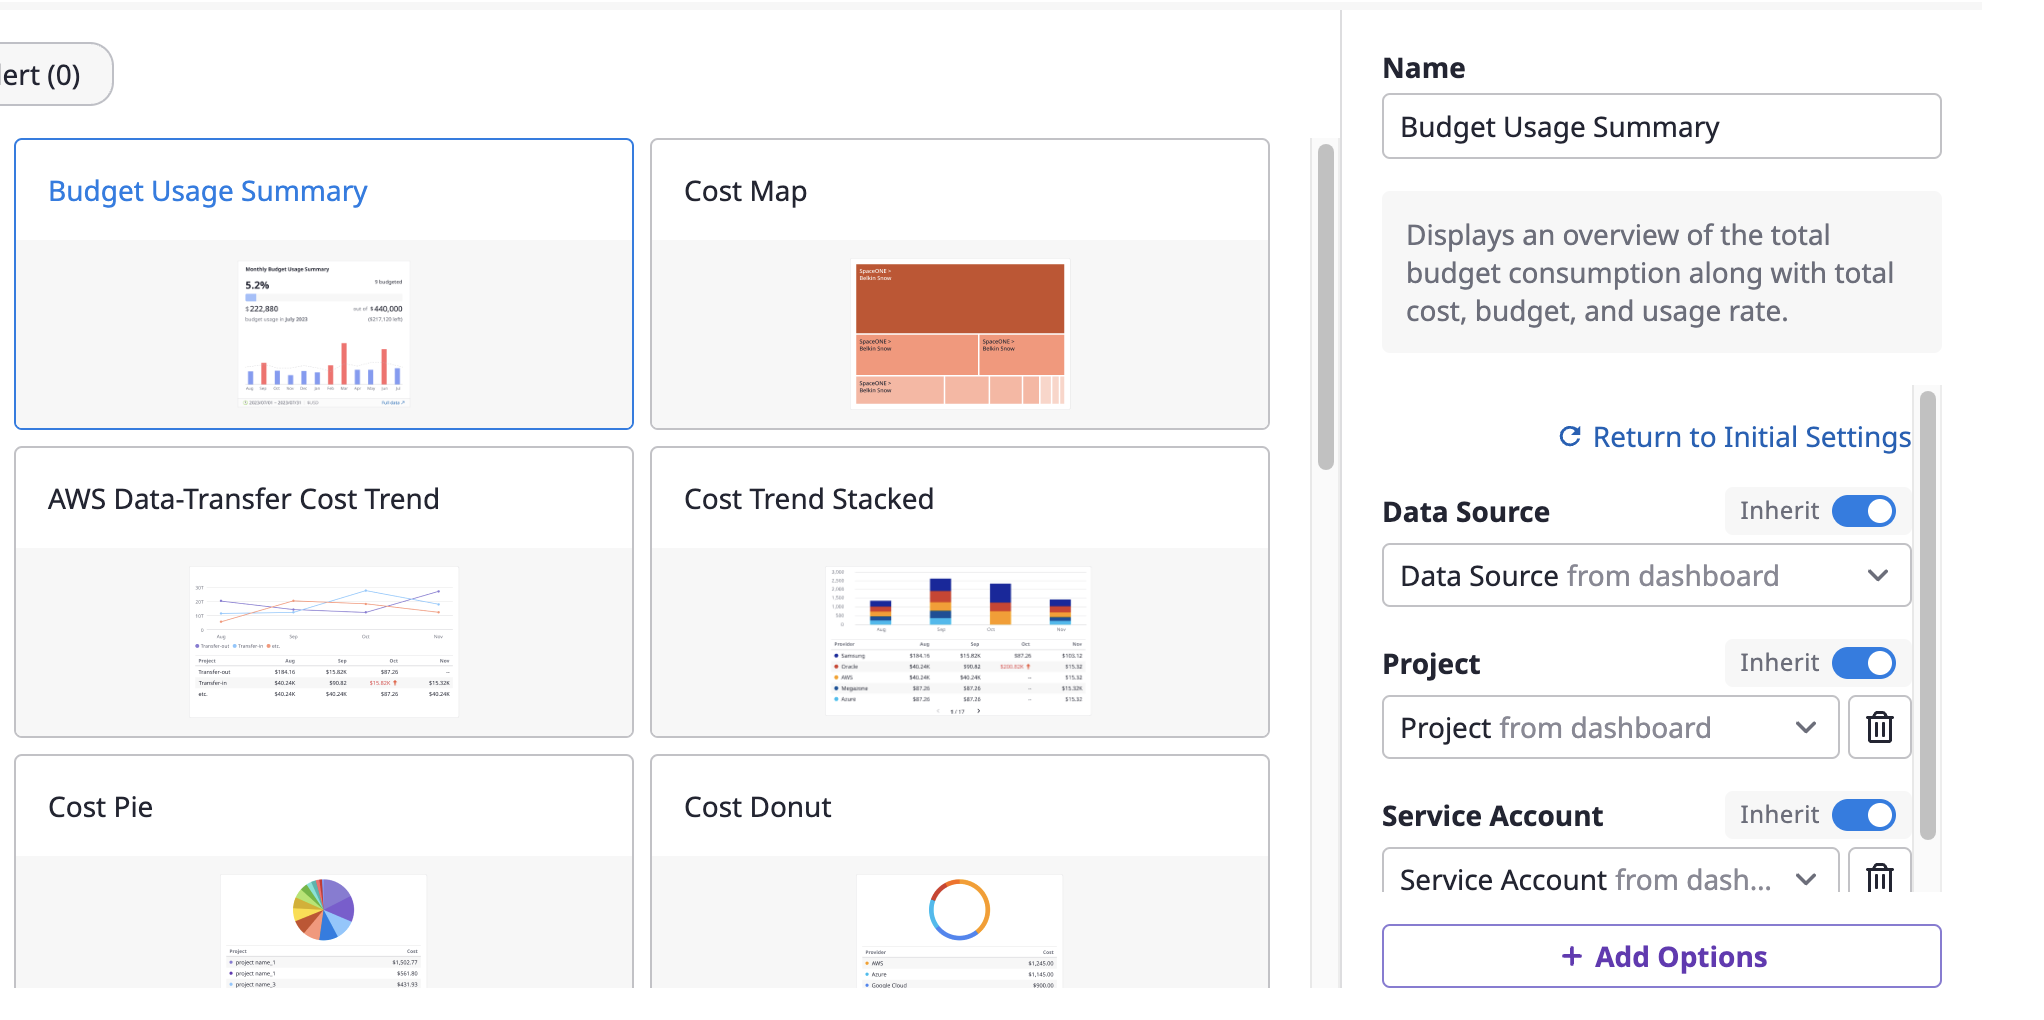
e.g. In the Cost Map widget, the
Project option is set to 'Inherit' and if you filter Project to 'Project A' at the dashboard level, the widget will now display data relevant to 'Project A' only.(2-3) If there are no additional options you want, you can click the [+Add Option] button to add them.
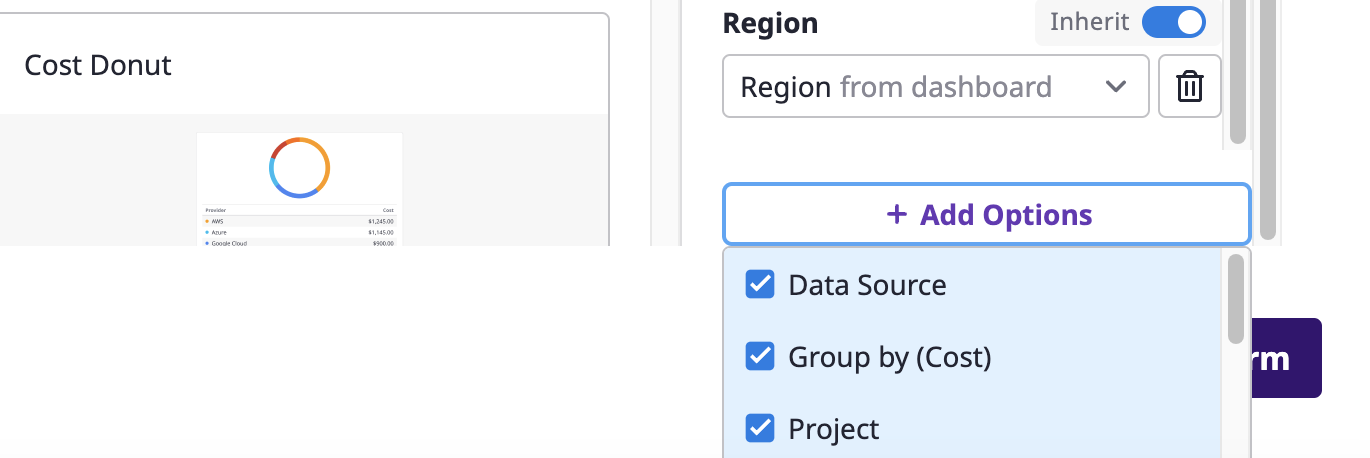
(2-4) When you've finished the configuration, click the [Confirm] button to complete adding widgets to the dashboard.
Rearrange the widget order
You can change the order by drag & drop the widget name button from the widget list in the right panel.
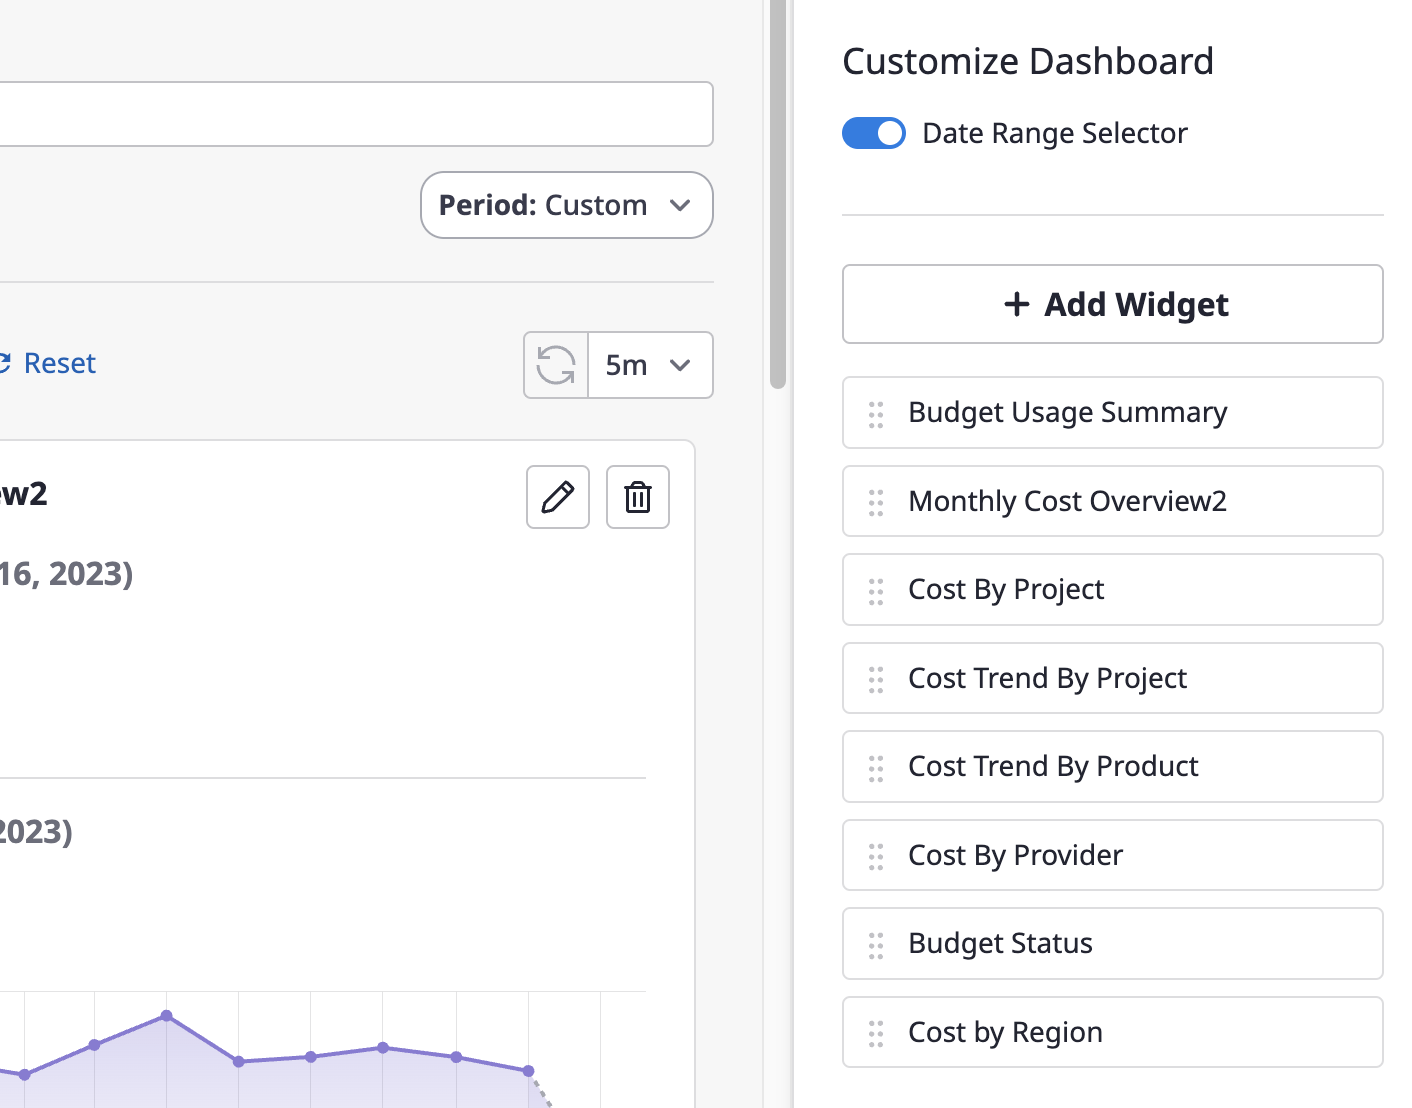
Enlarge widget size
If you want to view a widget in full-screen, click the [Full Screen] icon button in the top right corner of the widget.
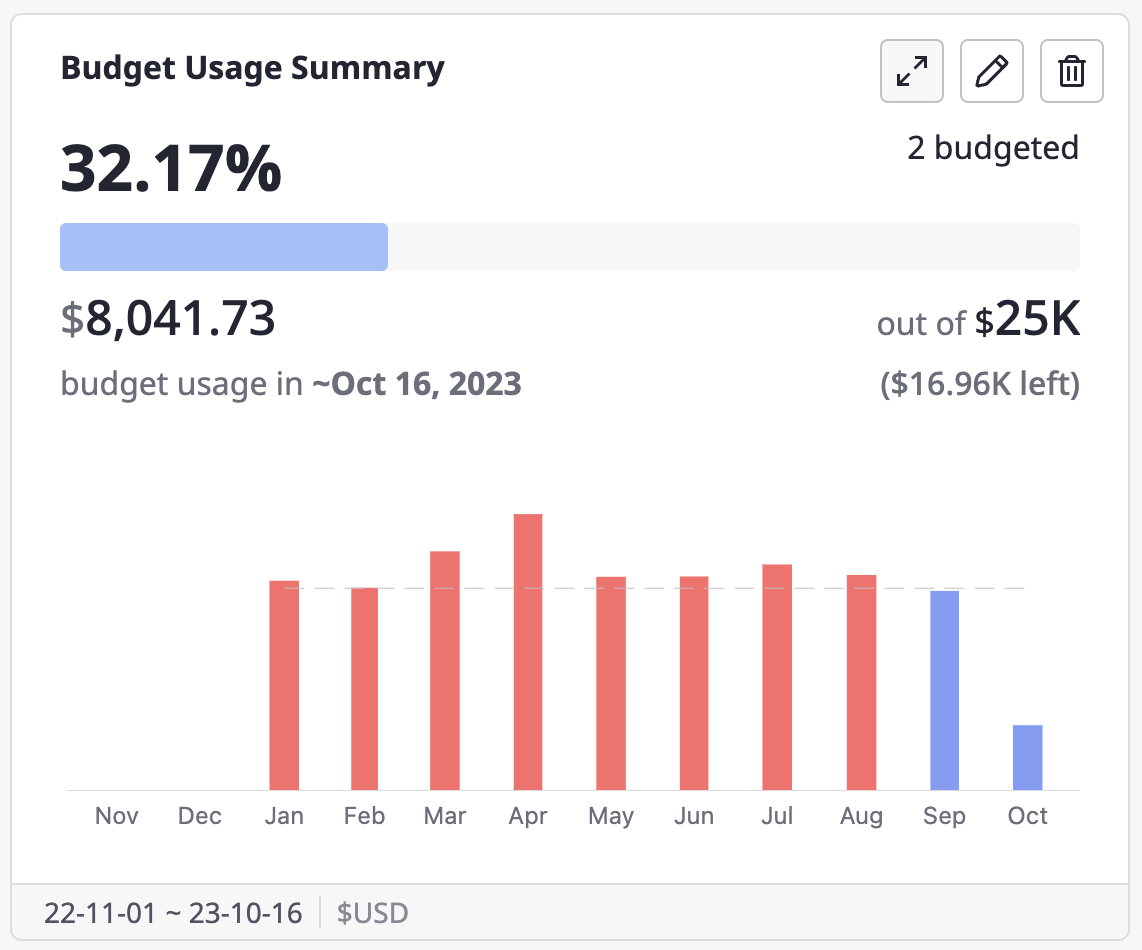

Edit a widget
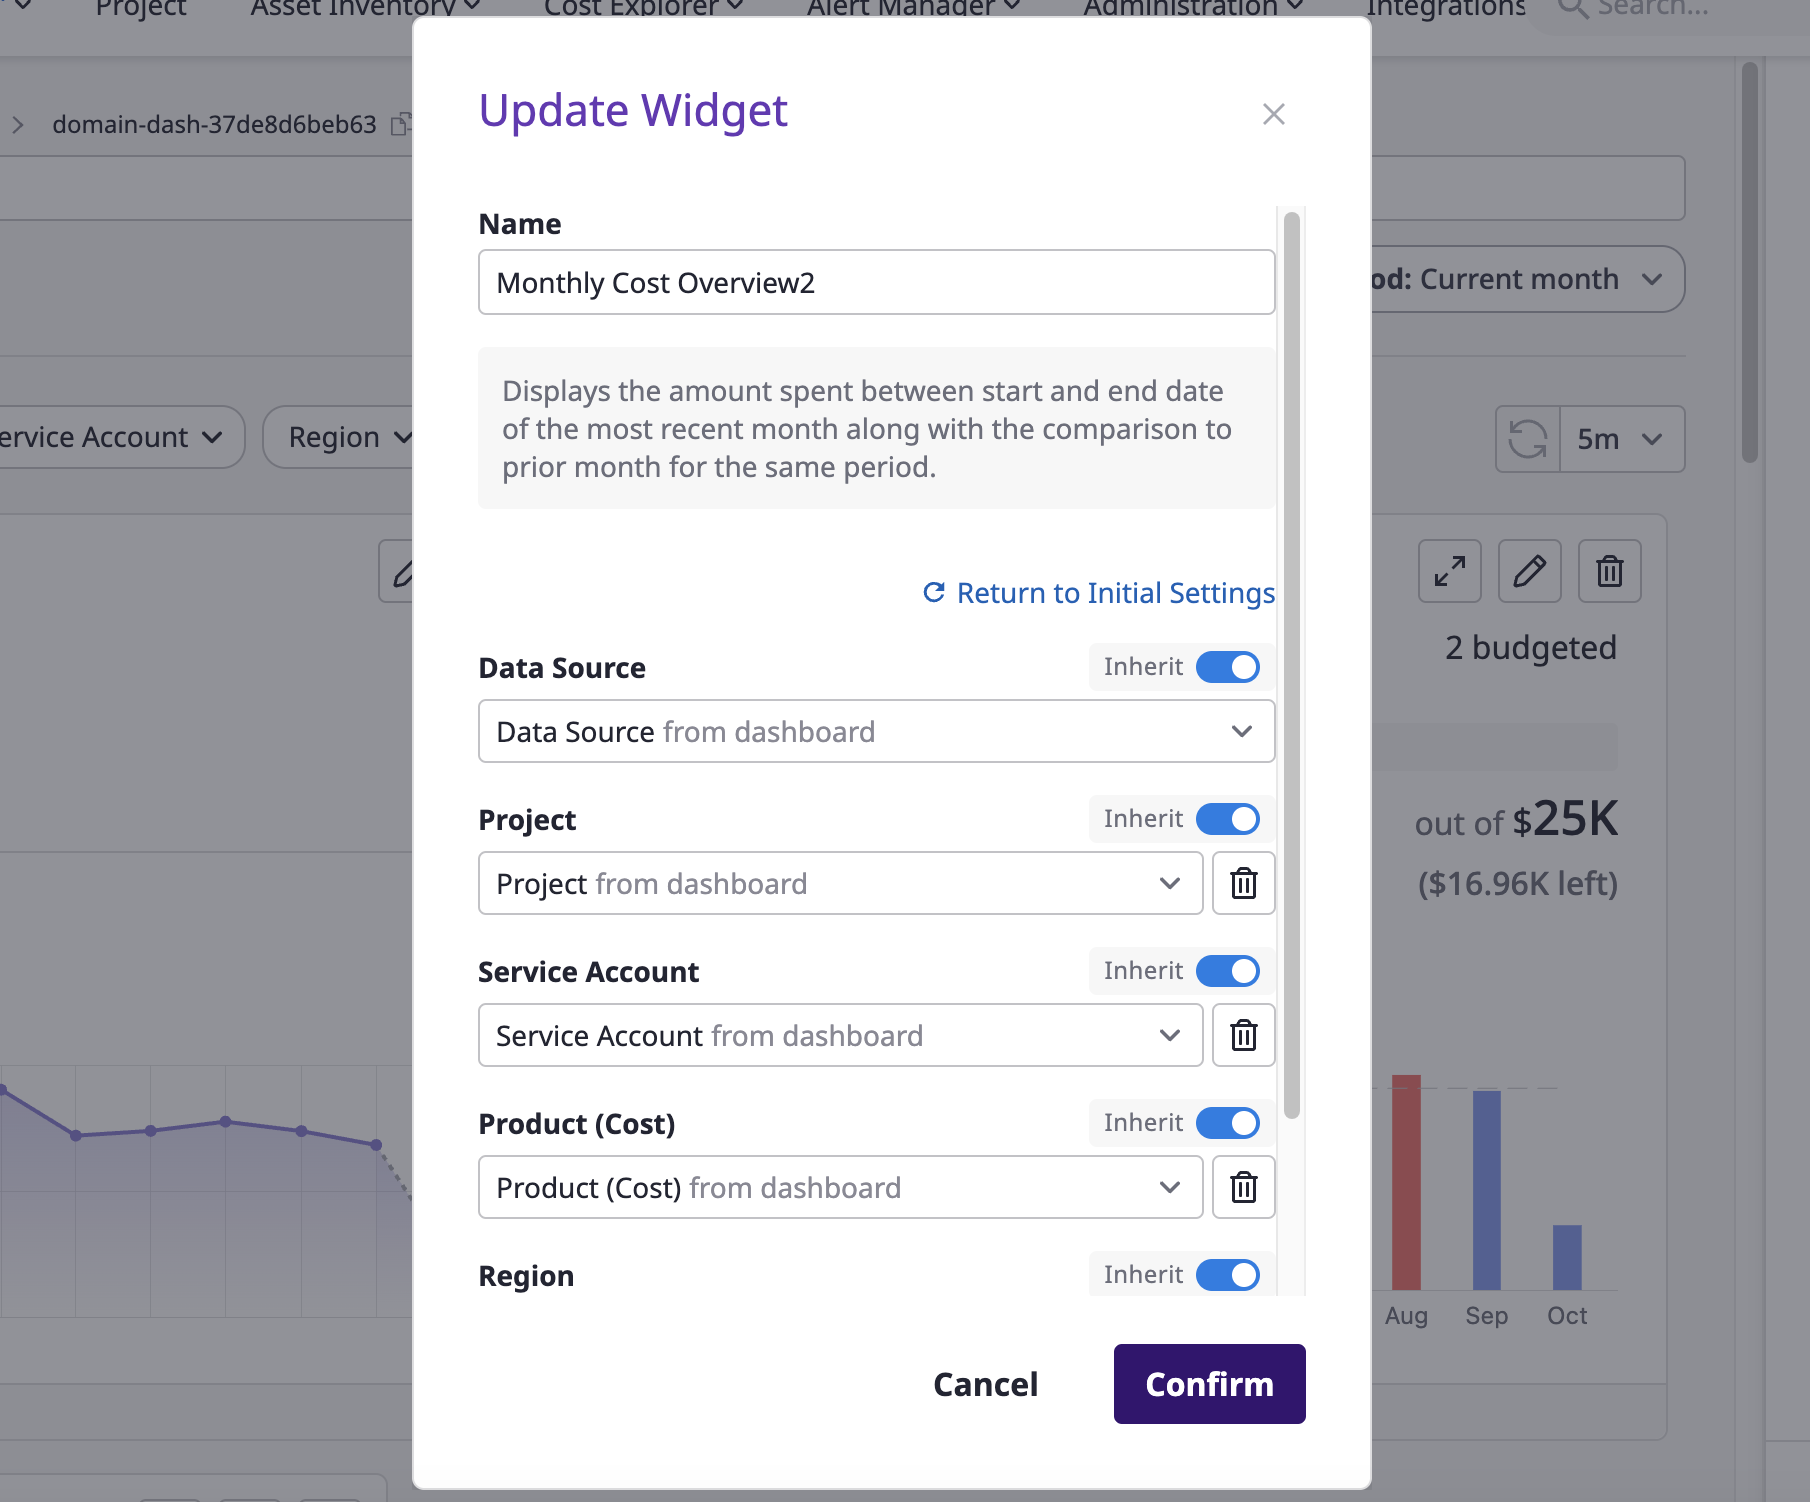
(1) Click the [Edit] icon button in the top right corner of the widget to edit it.
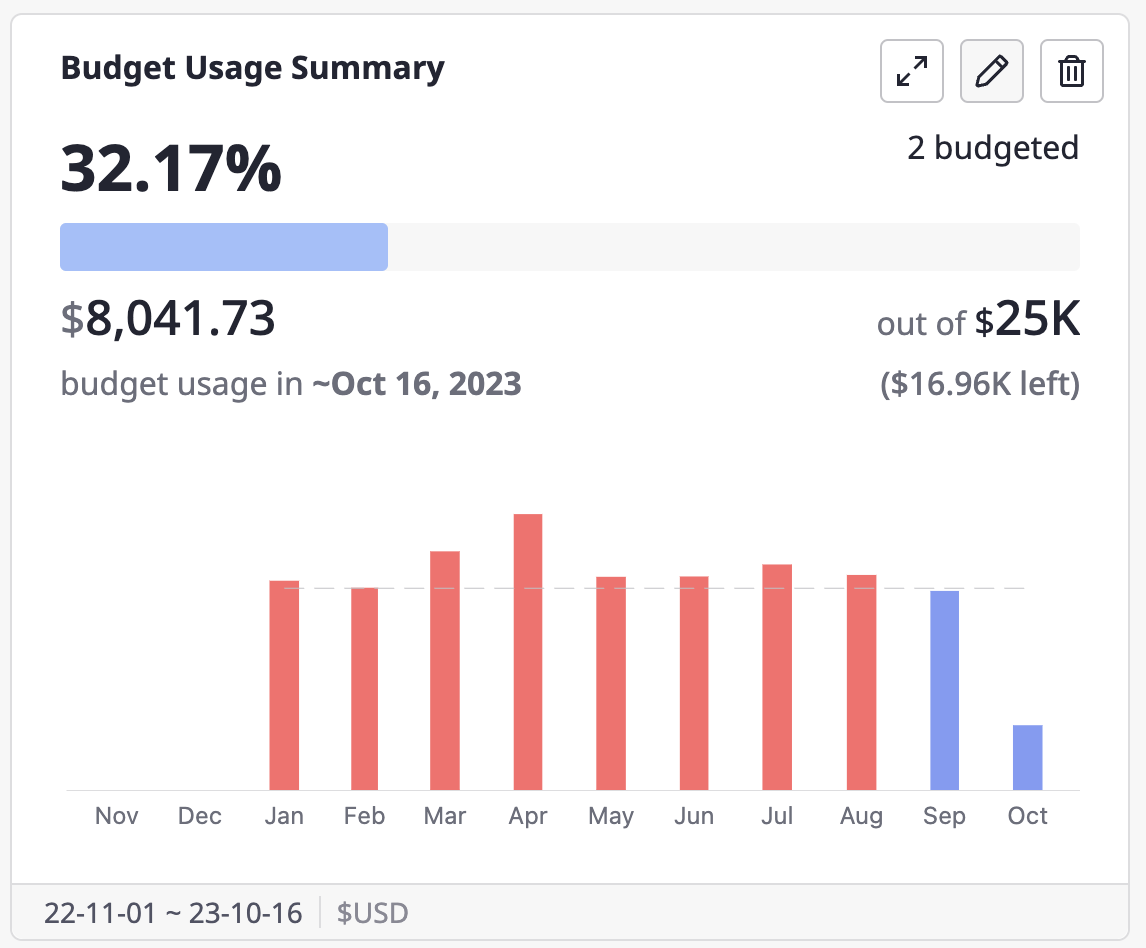
(2) You can edit the widget name and options, then click the [Confirm] button to save your changes. However, if you don't [Save] the dashboard in [Customize] mode, the edited widget won't be reflected in the final version.
- For information on widget option settings, please refer to here.
4 - Review & Quick Configuration
Editing a dashboard's name or Deleting/Duplicating
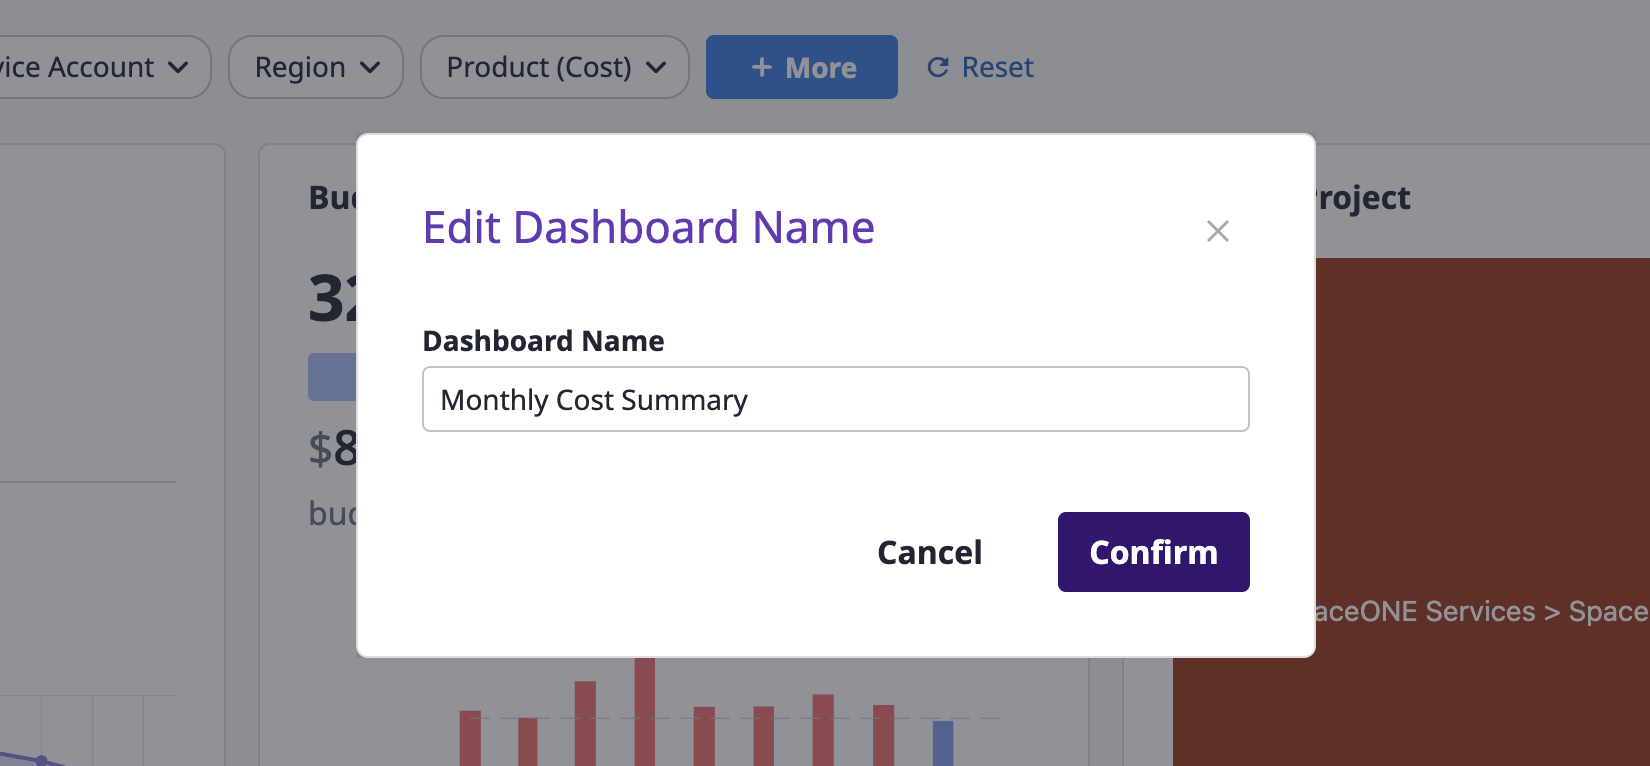
Editing a dashboard's name
(1) Click the [Edit] icon button next to the dashboard name.

(2) After changing the dashboard's name, click the [Confirm] button.
Deleting
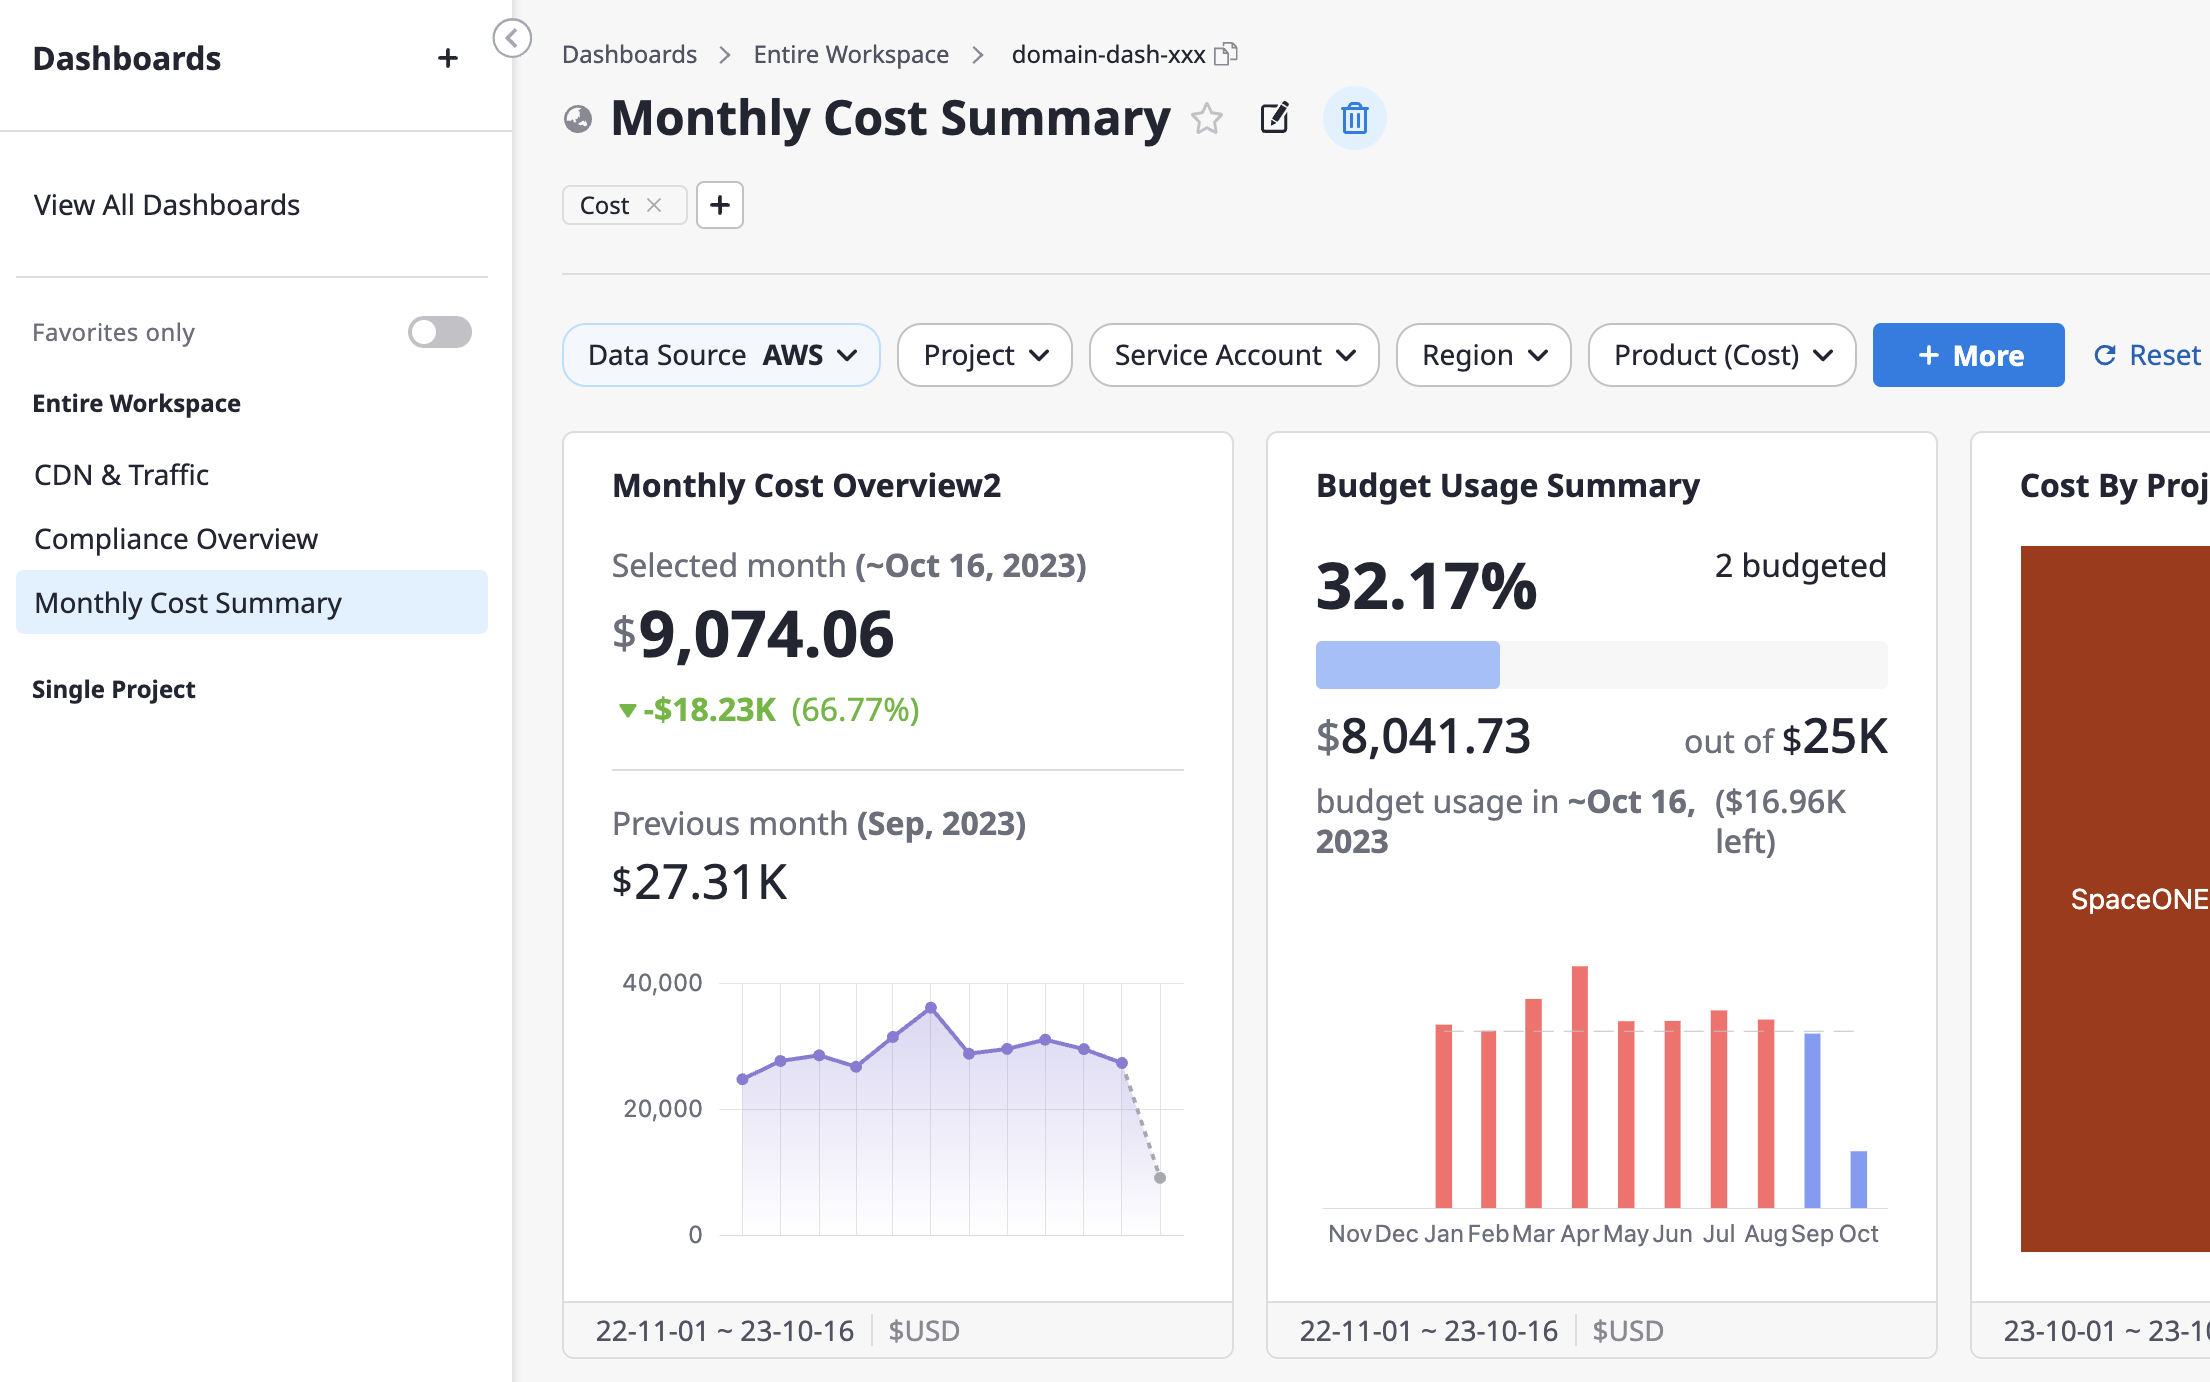
(1) Click the [Trash] icon button next to the dashboard name.
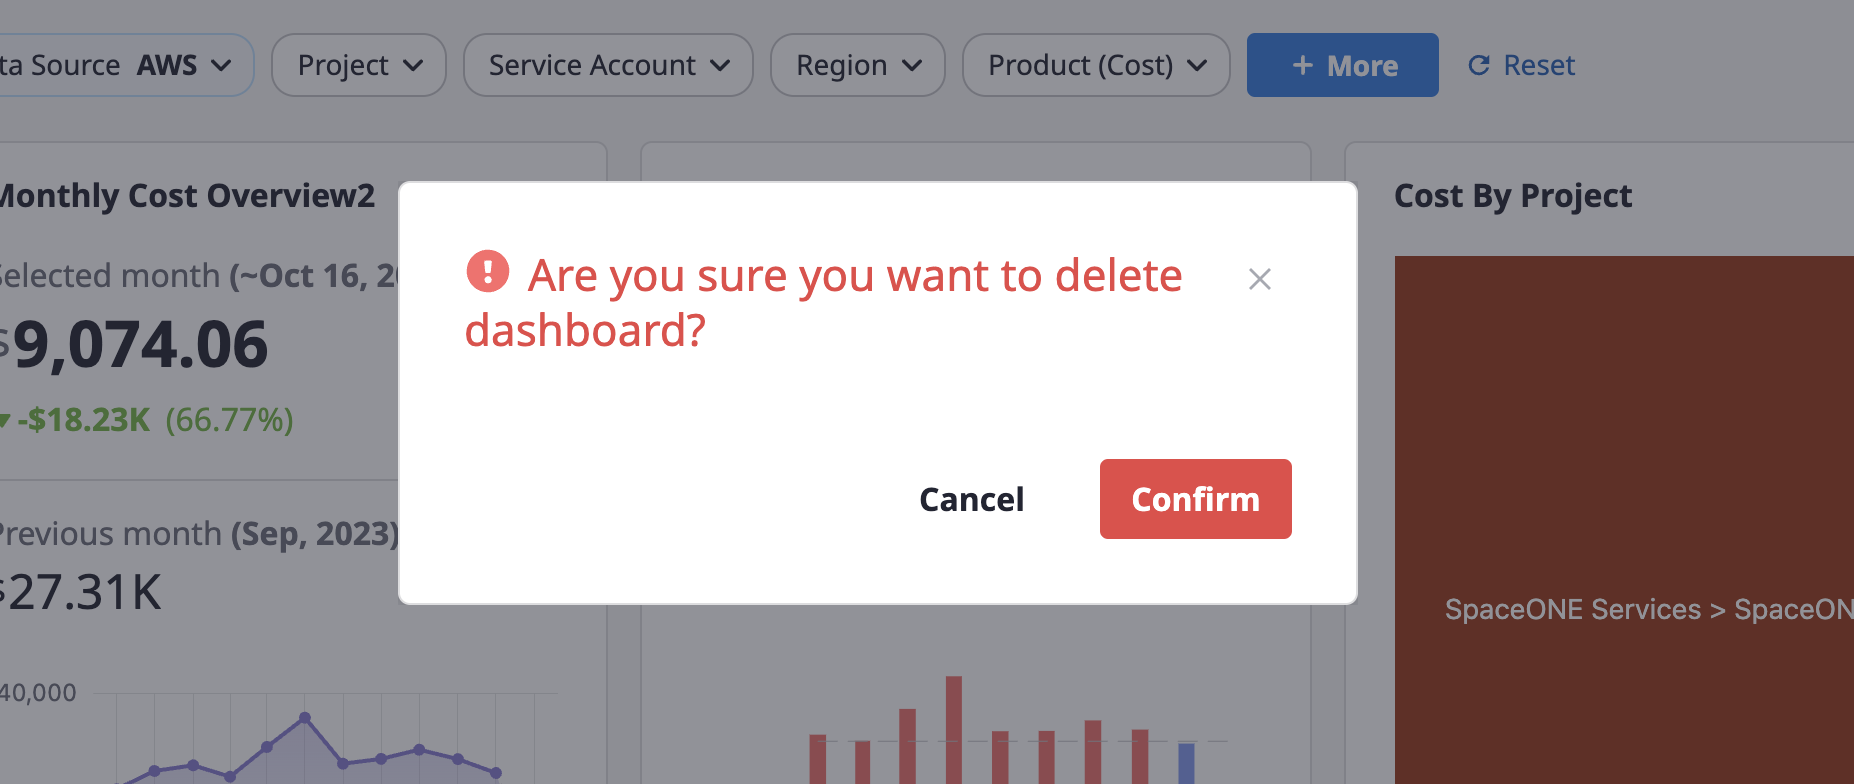
(2) Click the [Confirm] button in the [Delete Dashboard] modal to delete the dashboard.
Duplicating
(1) Click the [Clone] button on the right side of a dashboard.

(2) Select the following options and complete the cloning.
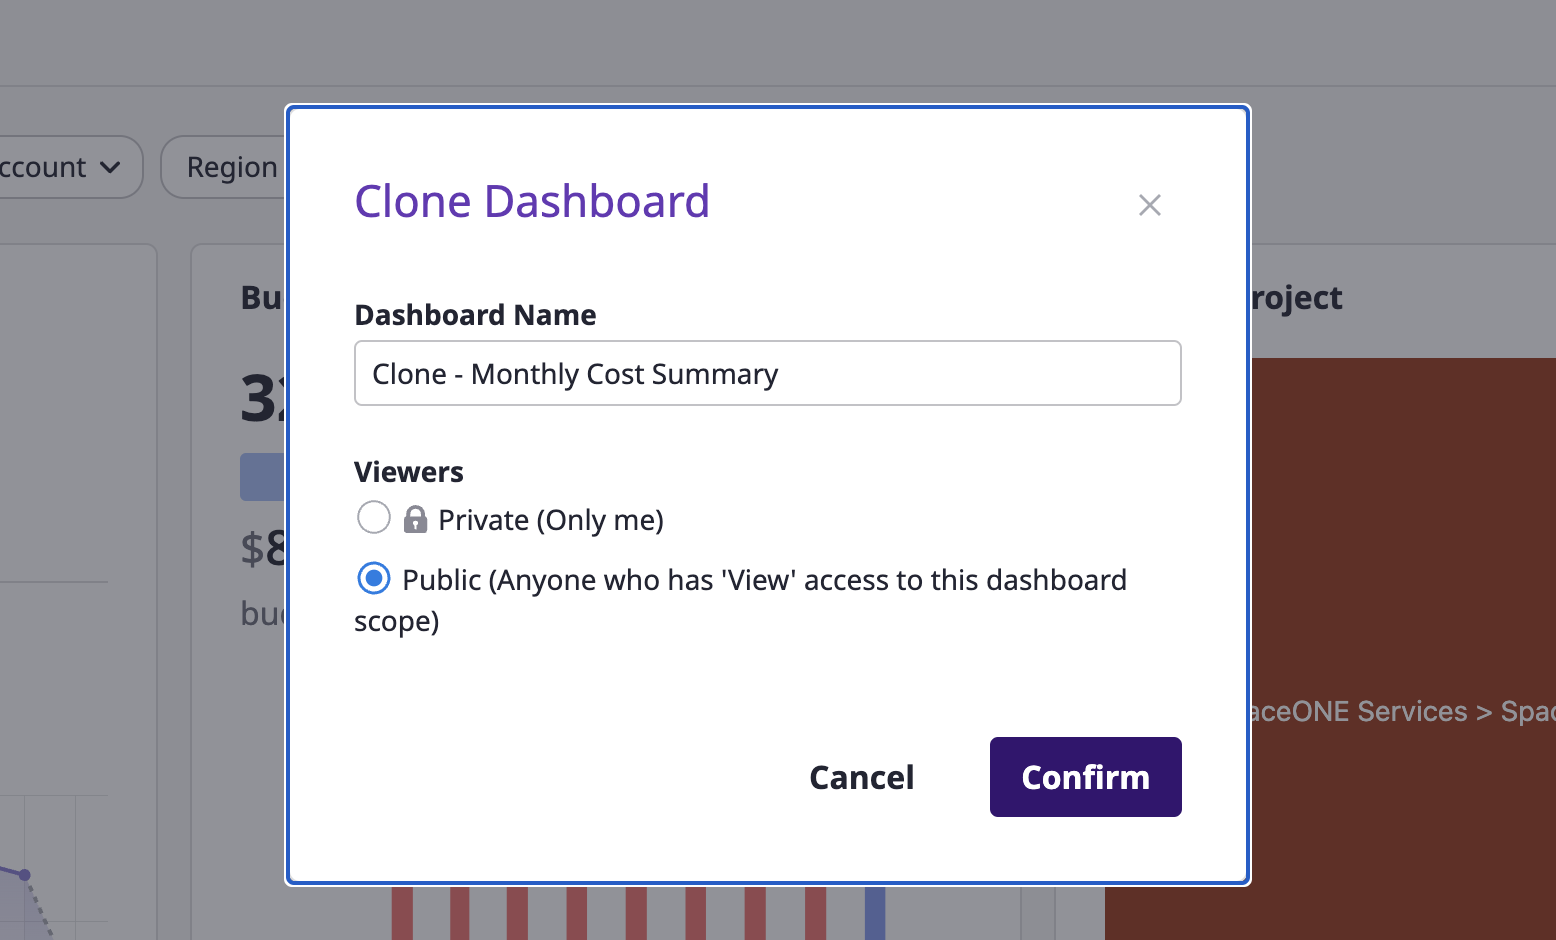
- Dashboard name
- Viewers: Select one between
PrivateandPublic.
Managing labels
Label addition/removal can be done in the same way as on here.

Setting filters
When you set up filters, you can view the dashboard data filtered by the desired conditions.
(1) Choose the specific options of the desired item from the Variables section at the top of the dashboard.
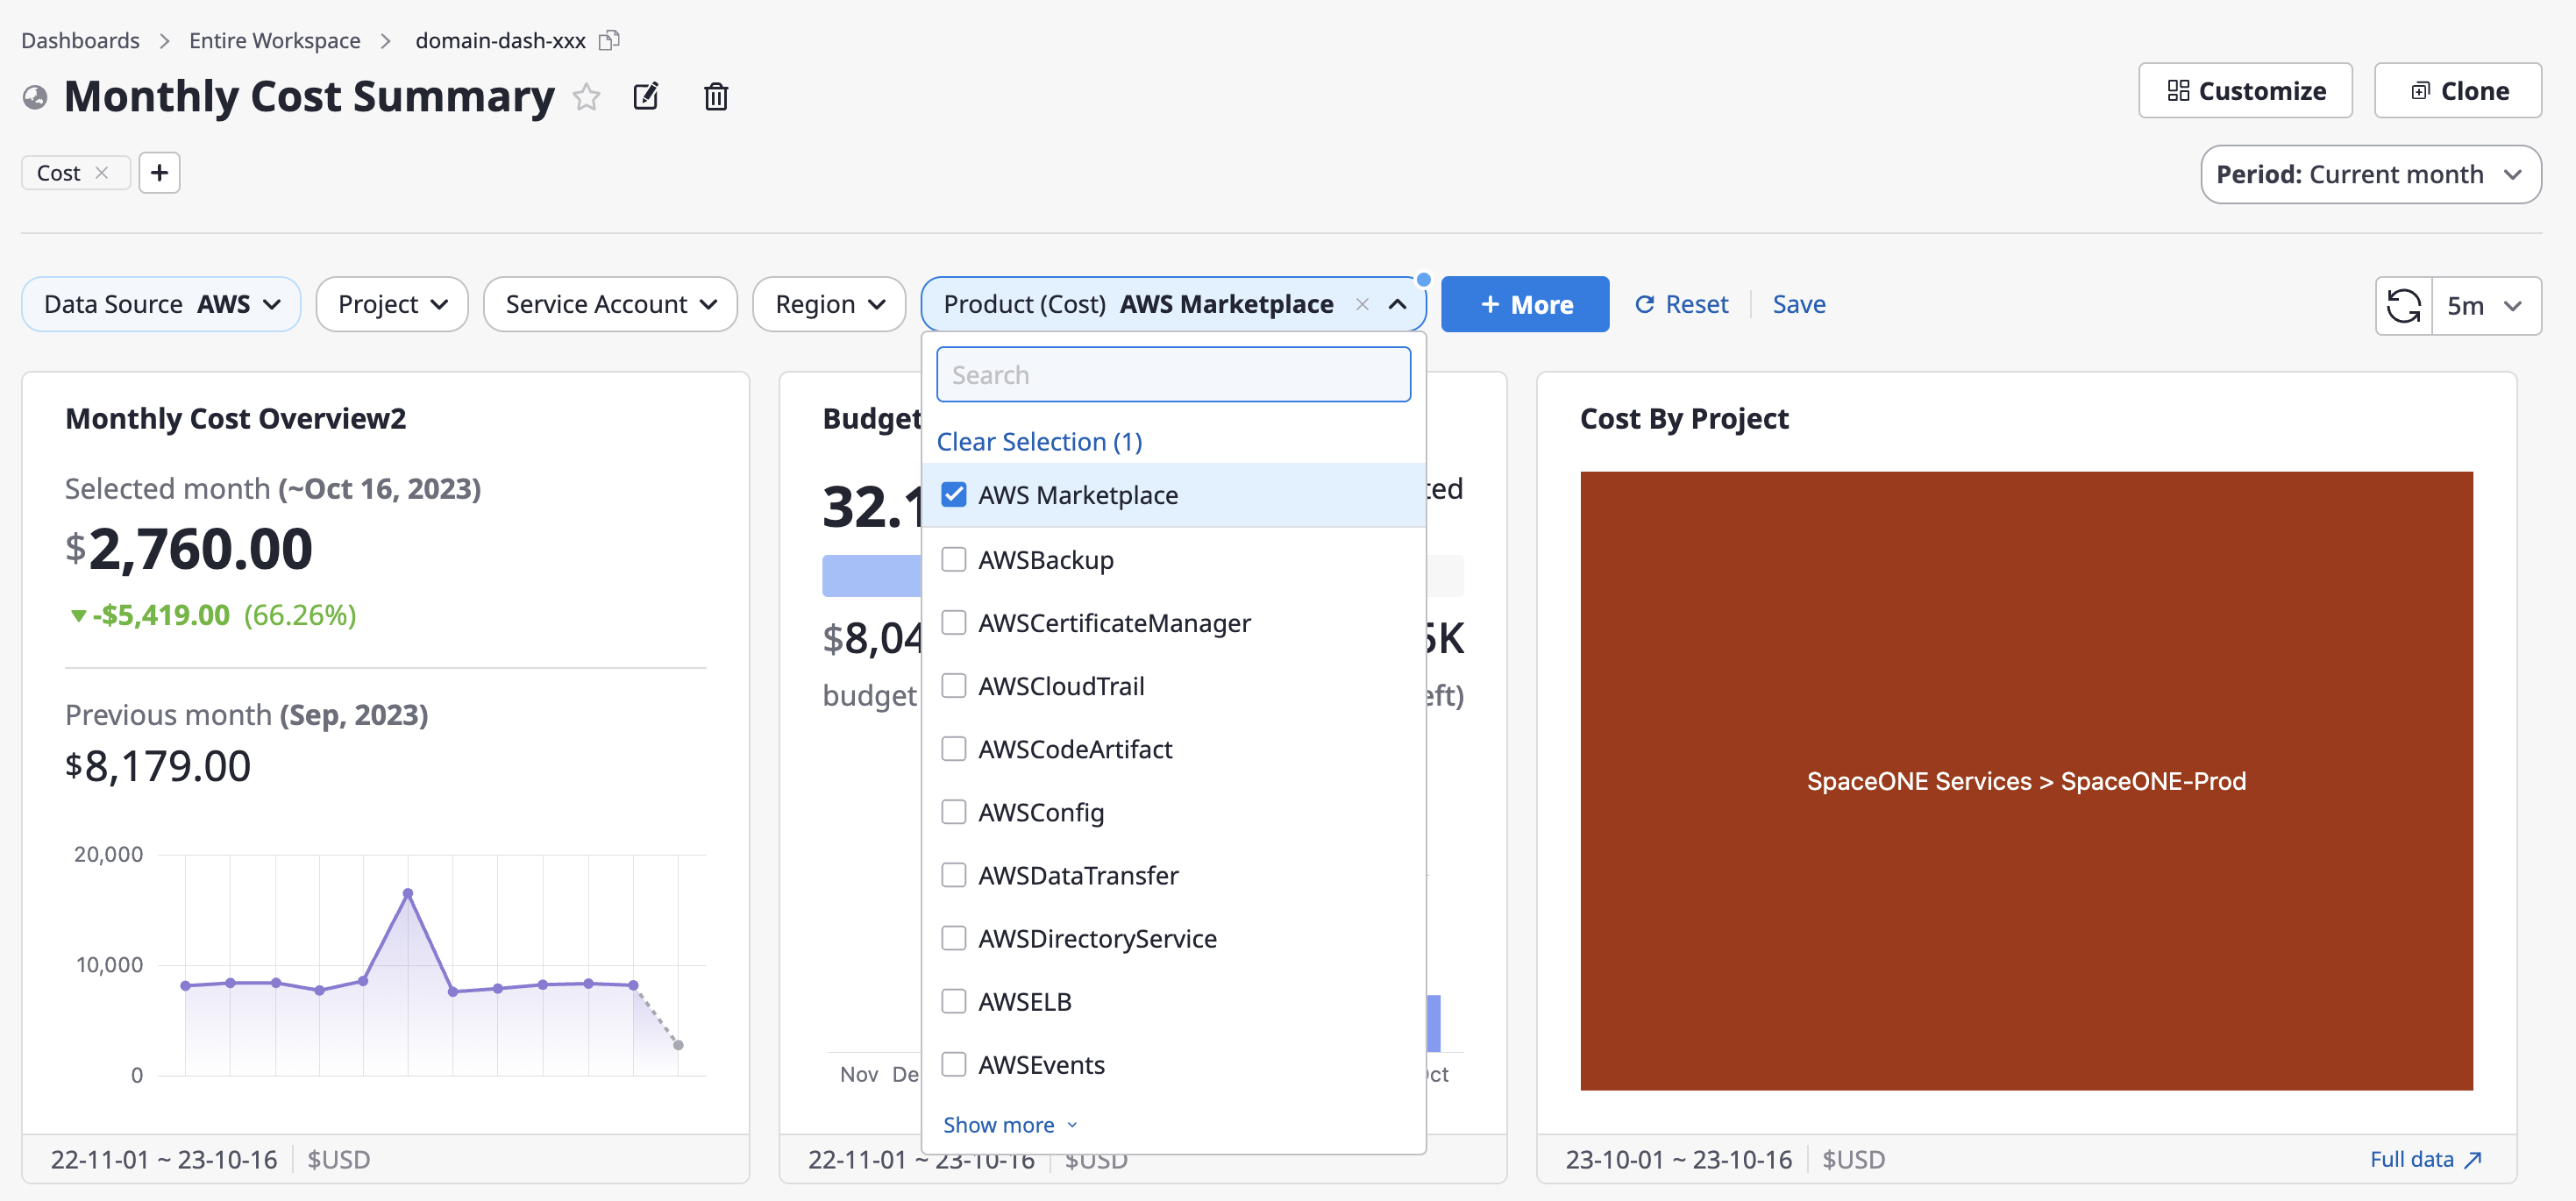
(2) If there are differences from the previously saved settings, the [Save] button on the right side will be activated, allowing you to quickly save the changes.

(3) If you want to revert your changes to the most recently saved values while in the process of changing options, click the [Reset] button.

(4) Click the [+ More] > [Manage Variables] button to review all available variables or add custom variables.
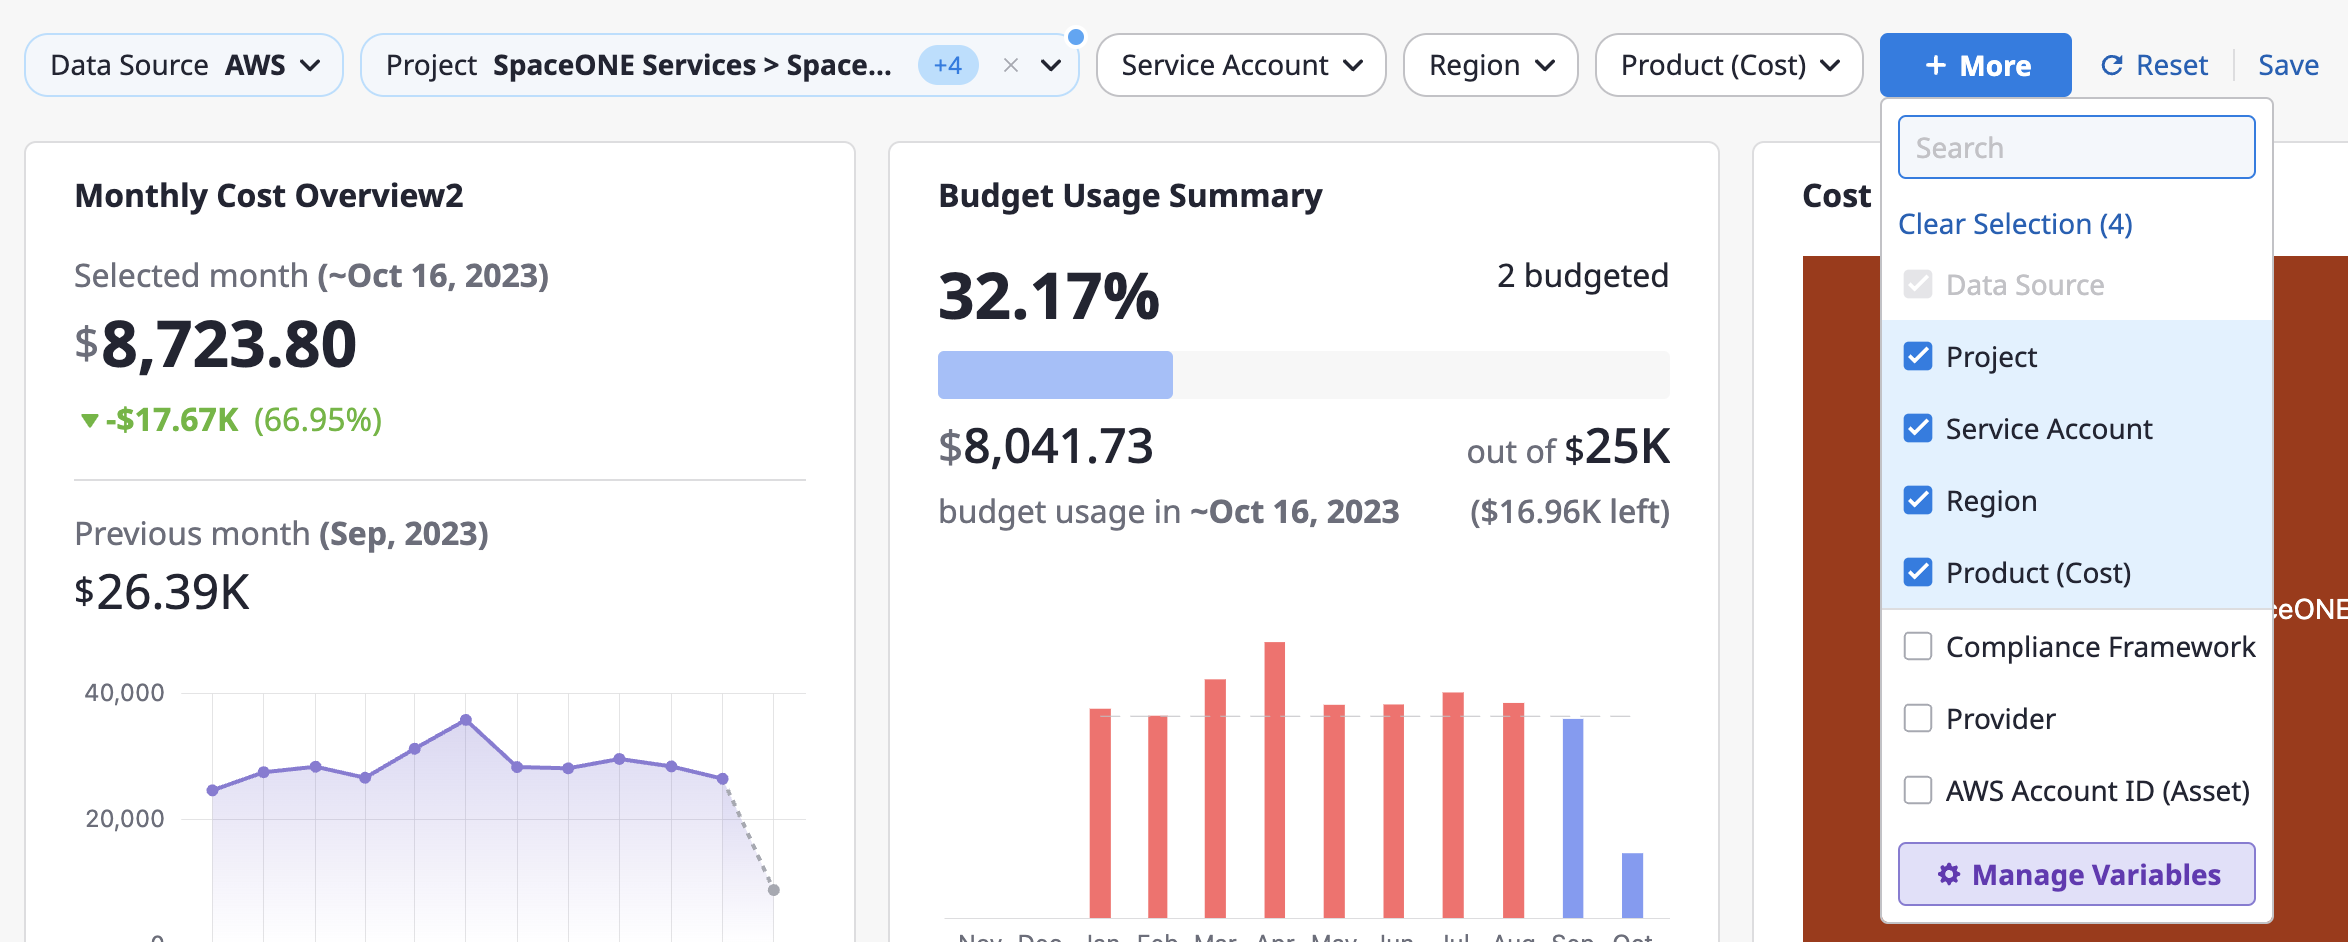
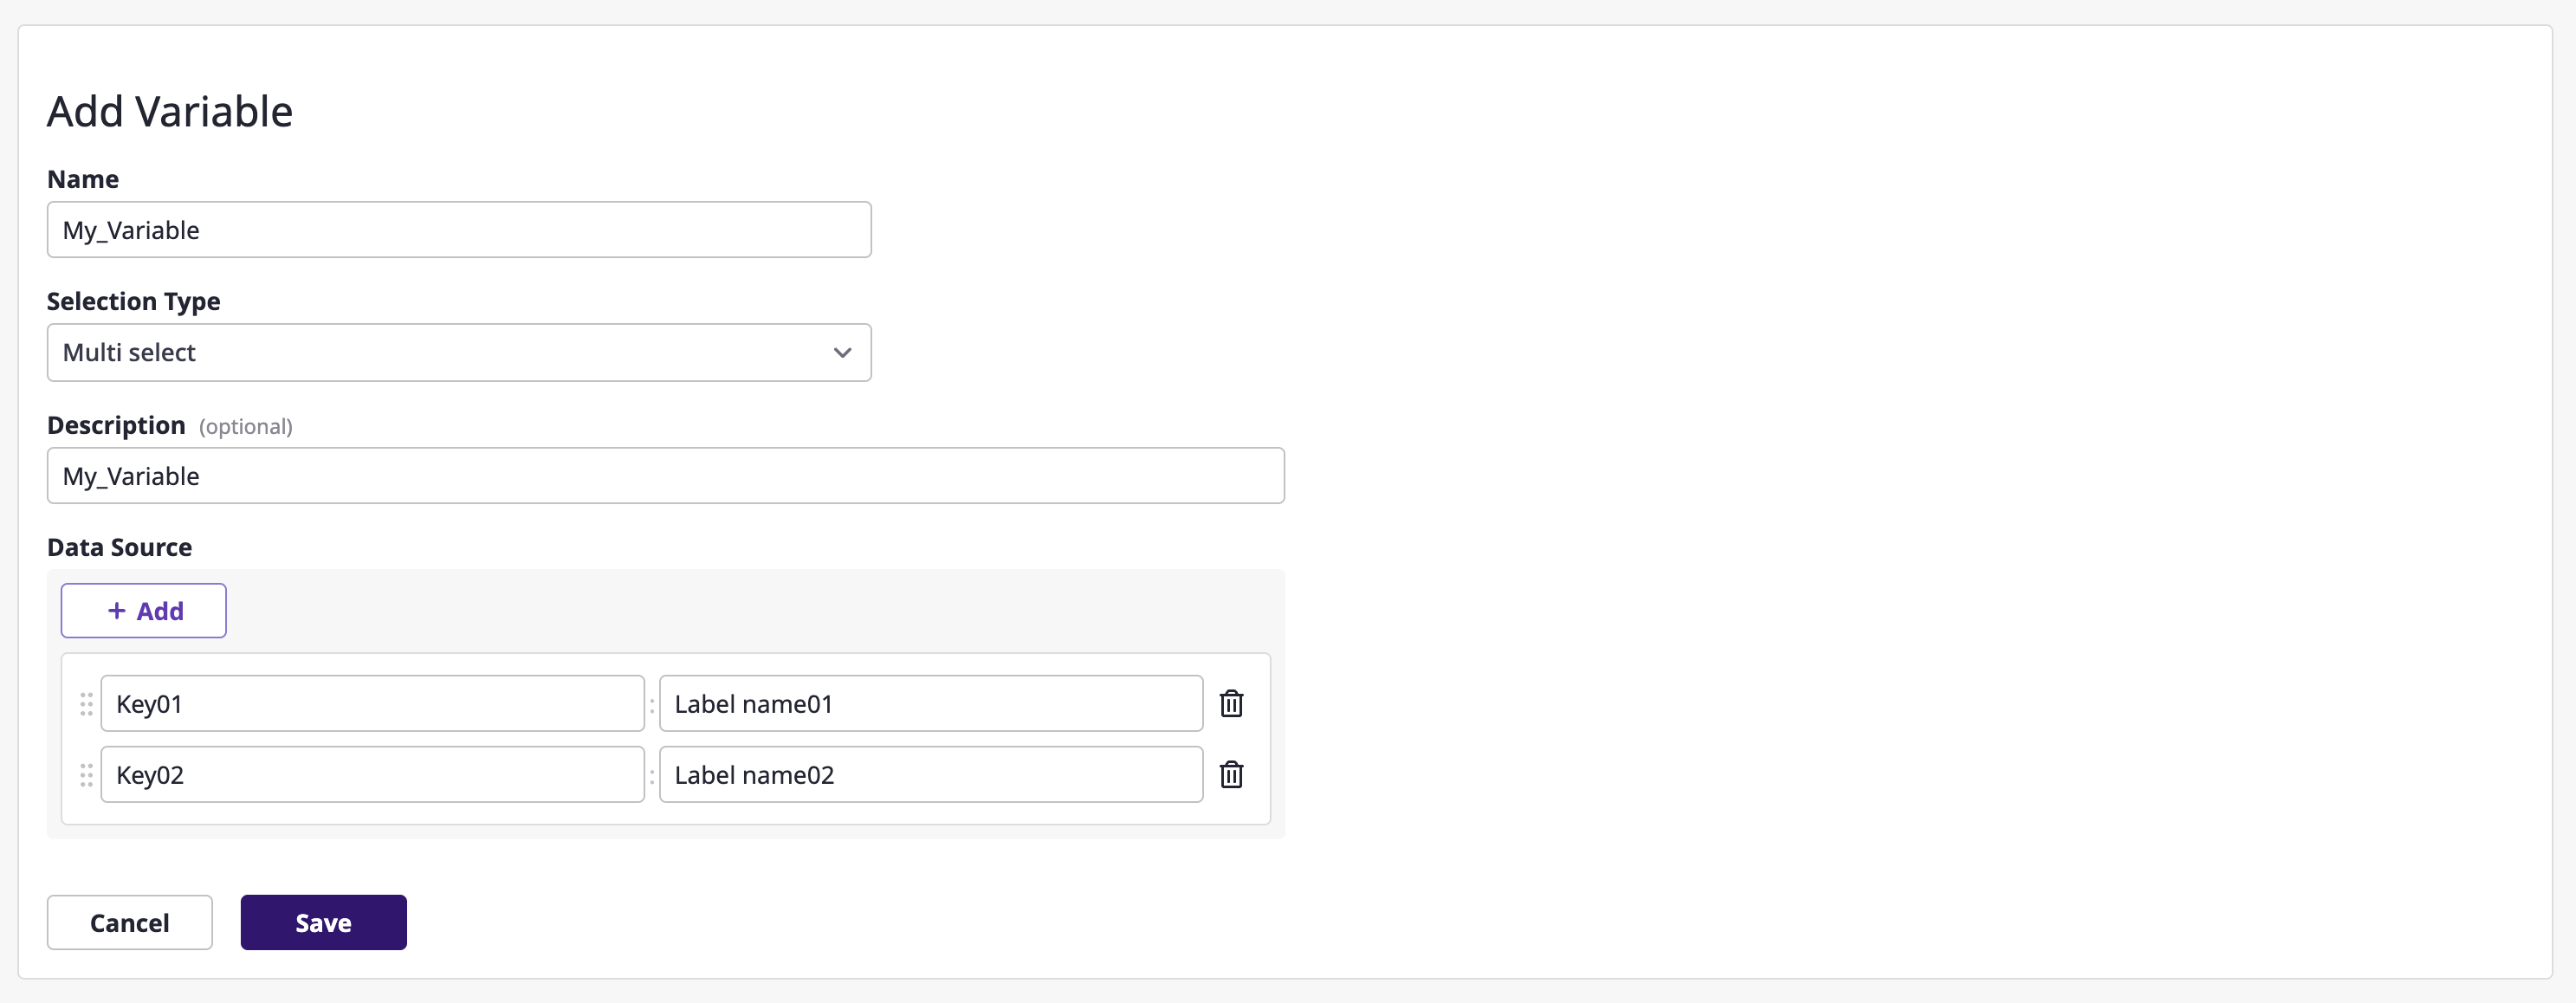
(4-1) If you need to add custom variables, click the [+ Add Variable] button in the upper right corner of the [Manage Variables] window.
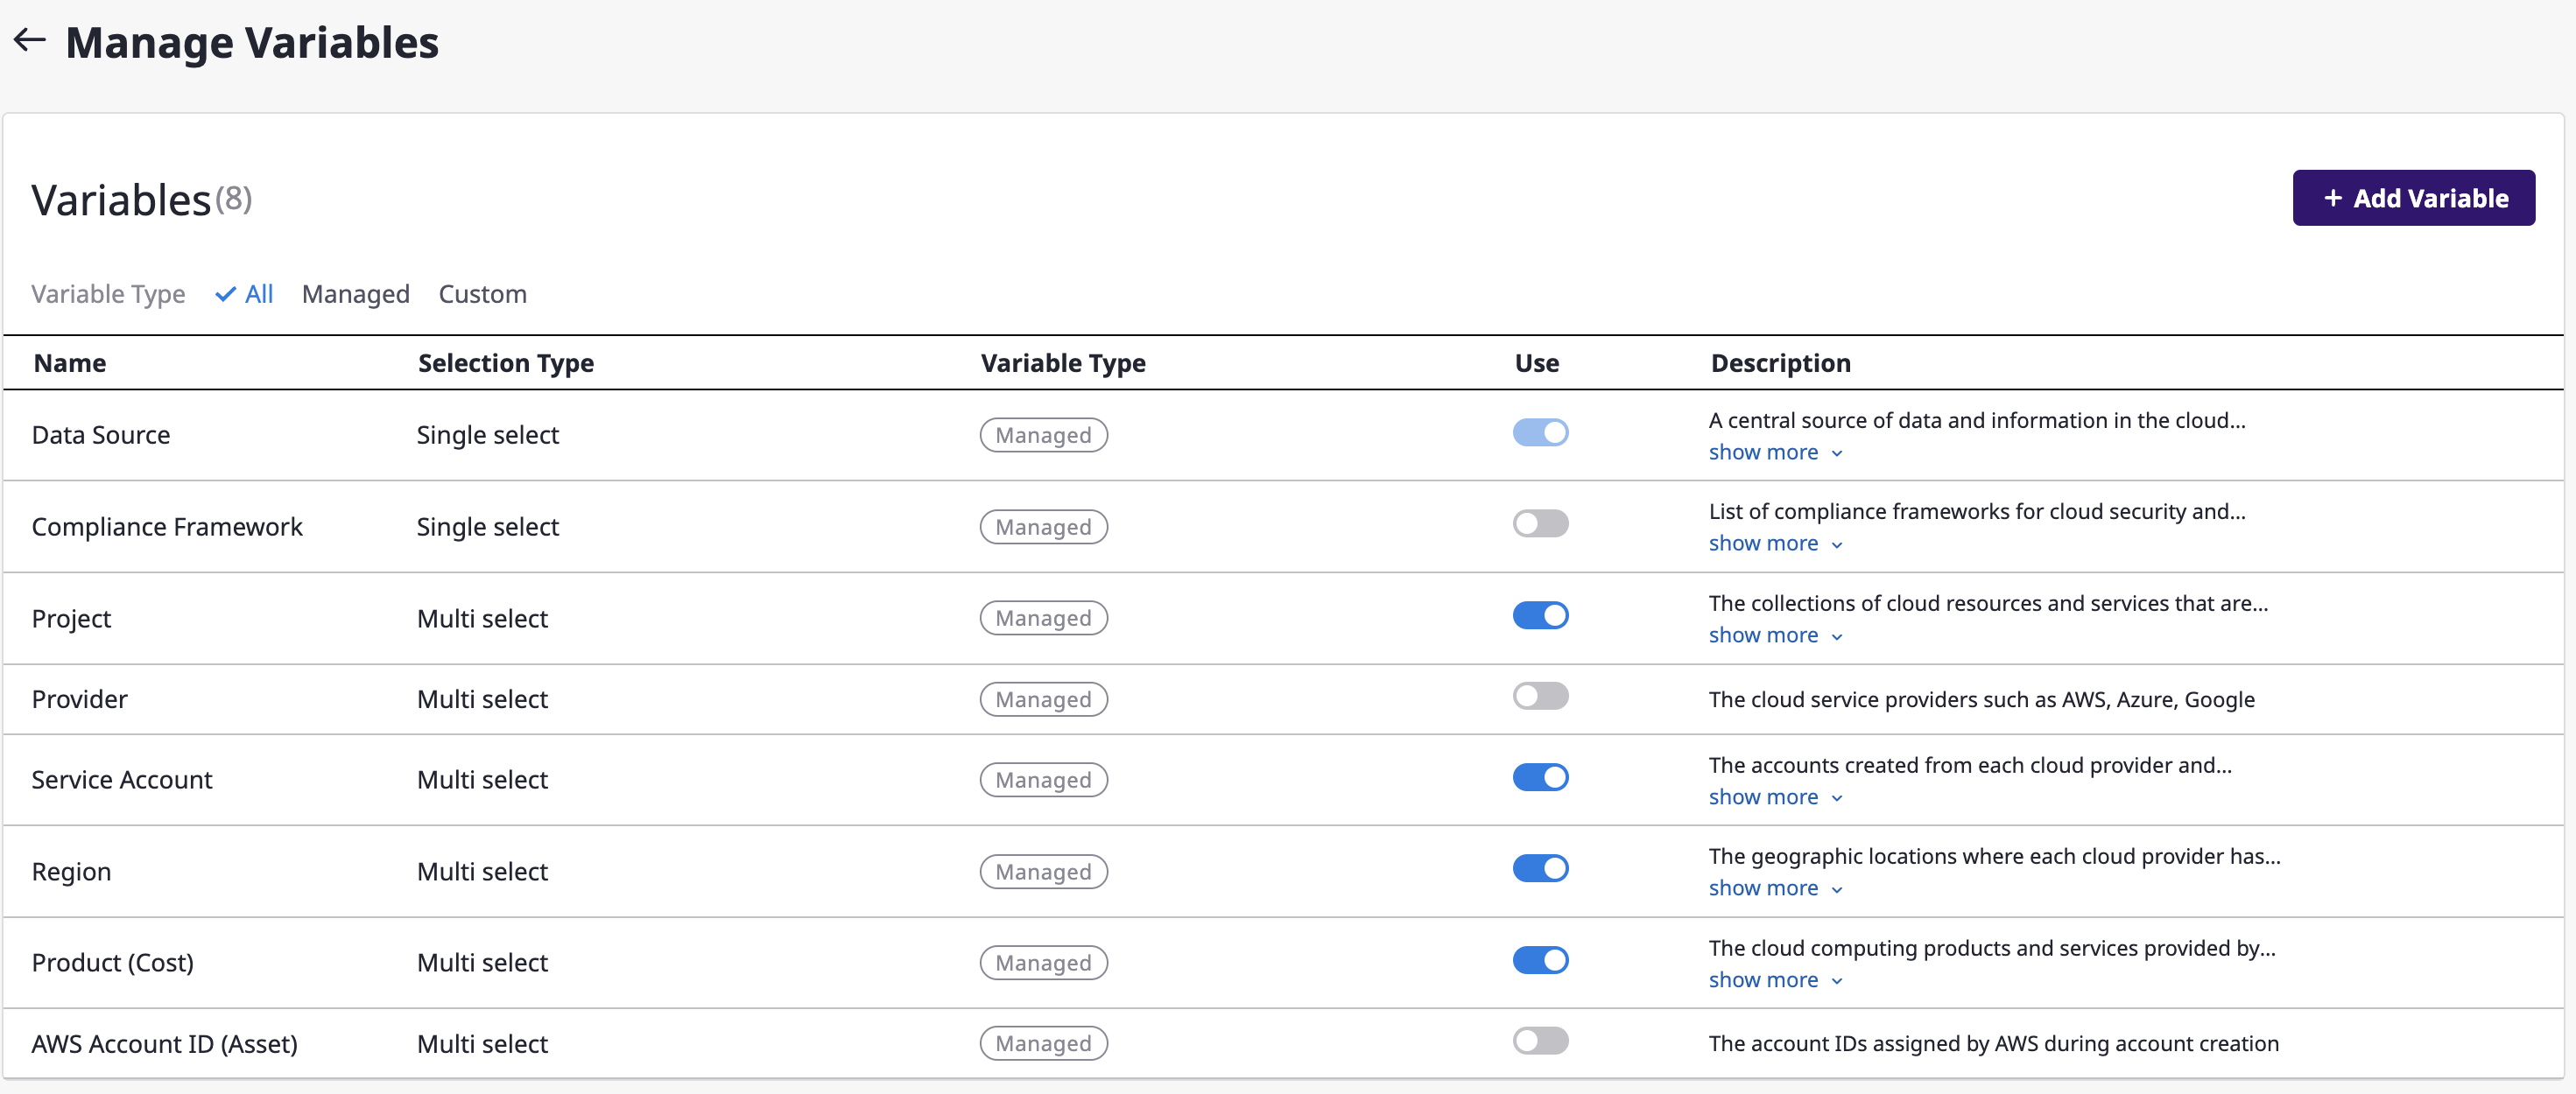
(4-2) After entering the basic information for the variable you want to add, click the [Save] button.
Setting the period
In the dashboard's top-right [Period] dropdown, you can select a specific month or choose a specific month within the last 3 years using the [Custom] menu.
Configuring auto data refresh
You can select the data refresh interval from the [Refresh] dropdown in the top right corner of the dashboard.
Viewing and editing widget settings
(1) Click the [Full Screen] icon button in the top-right corner of a specific widget
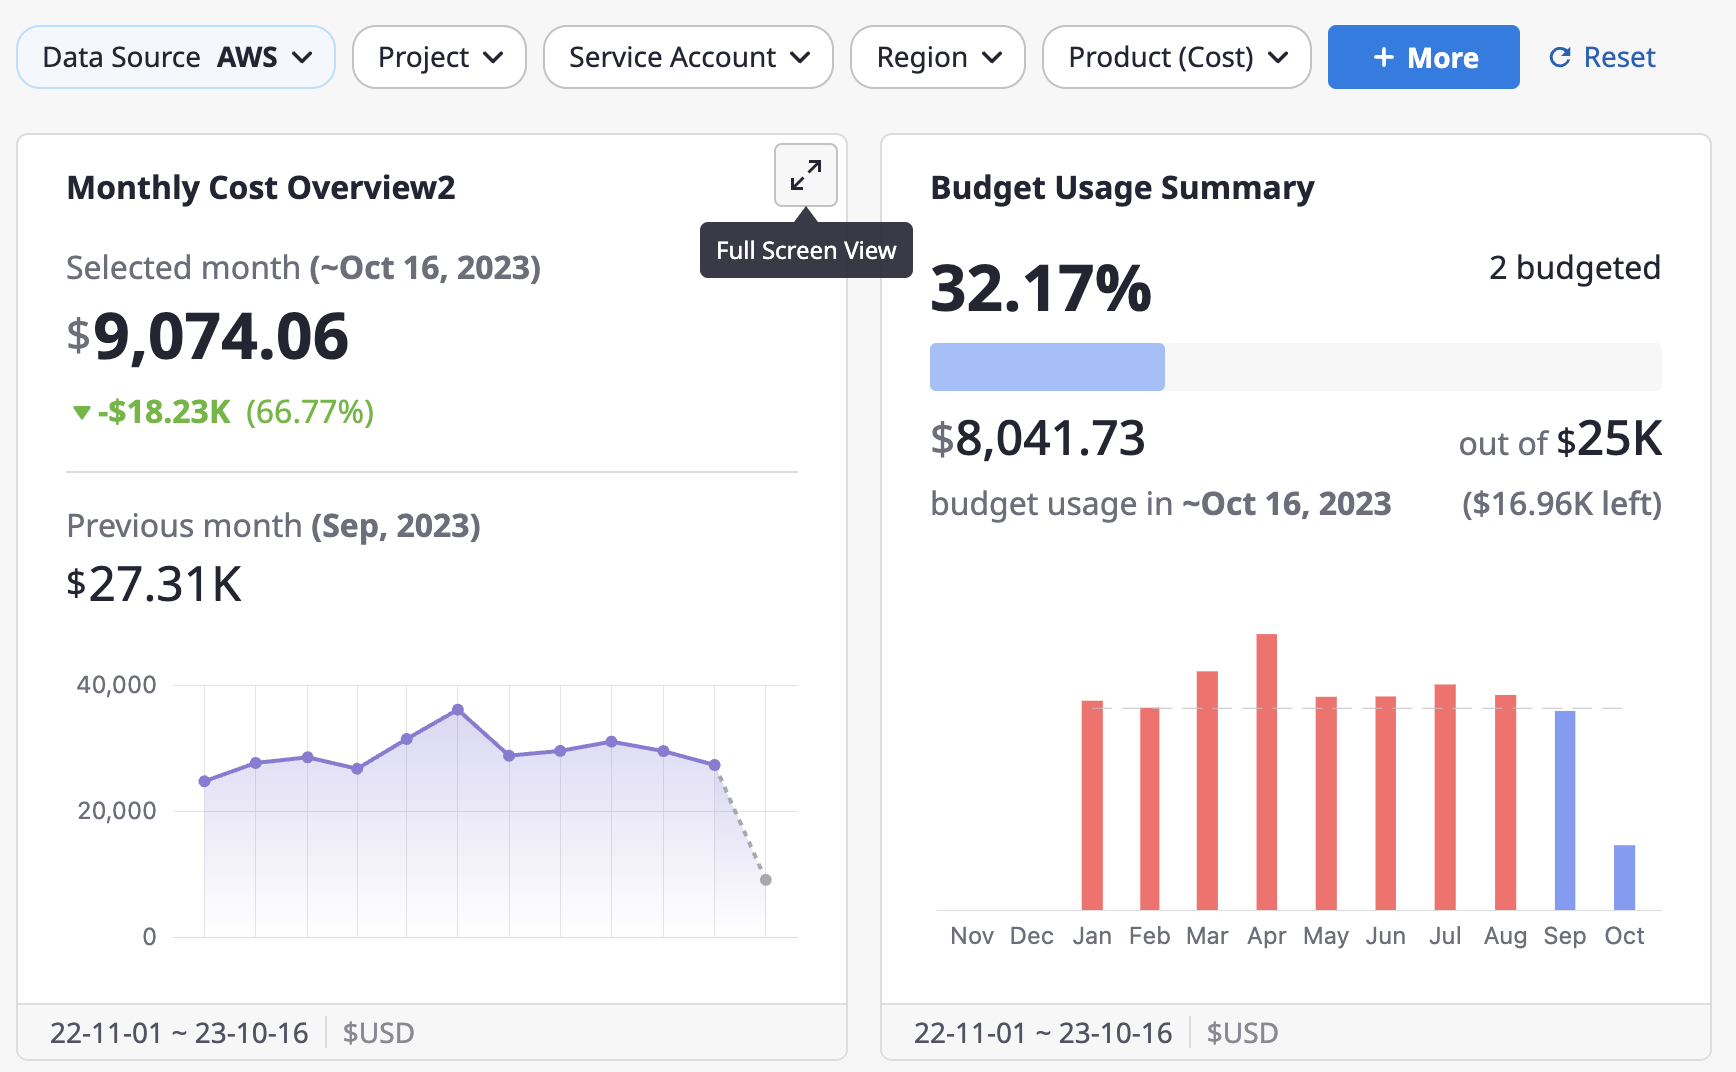
(2) In full-screen mode, you can examine detailed widget data. The top filter options are the same as the dashboard variables, and you can explore each option to get a closer look at the widget's data.
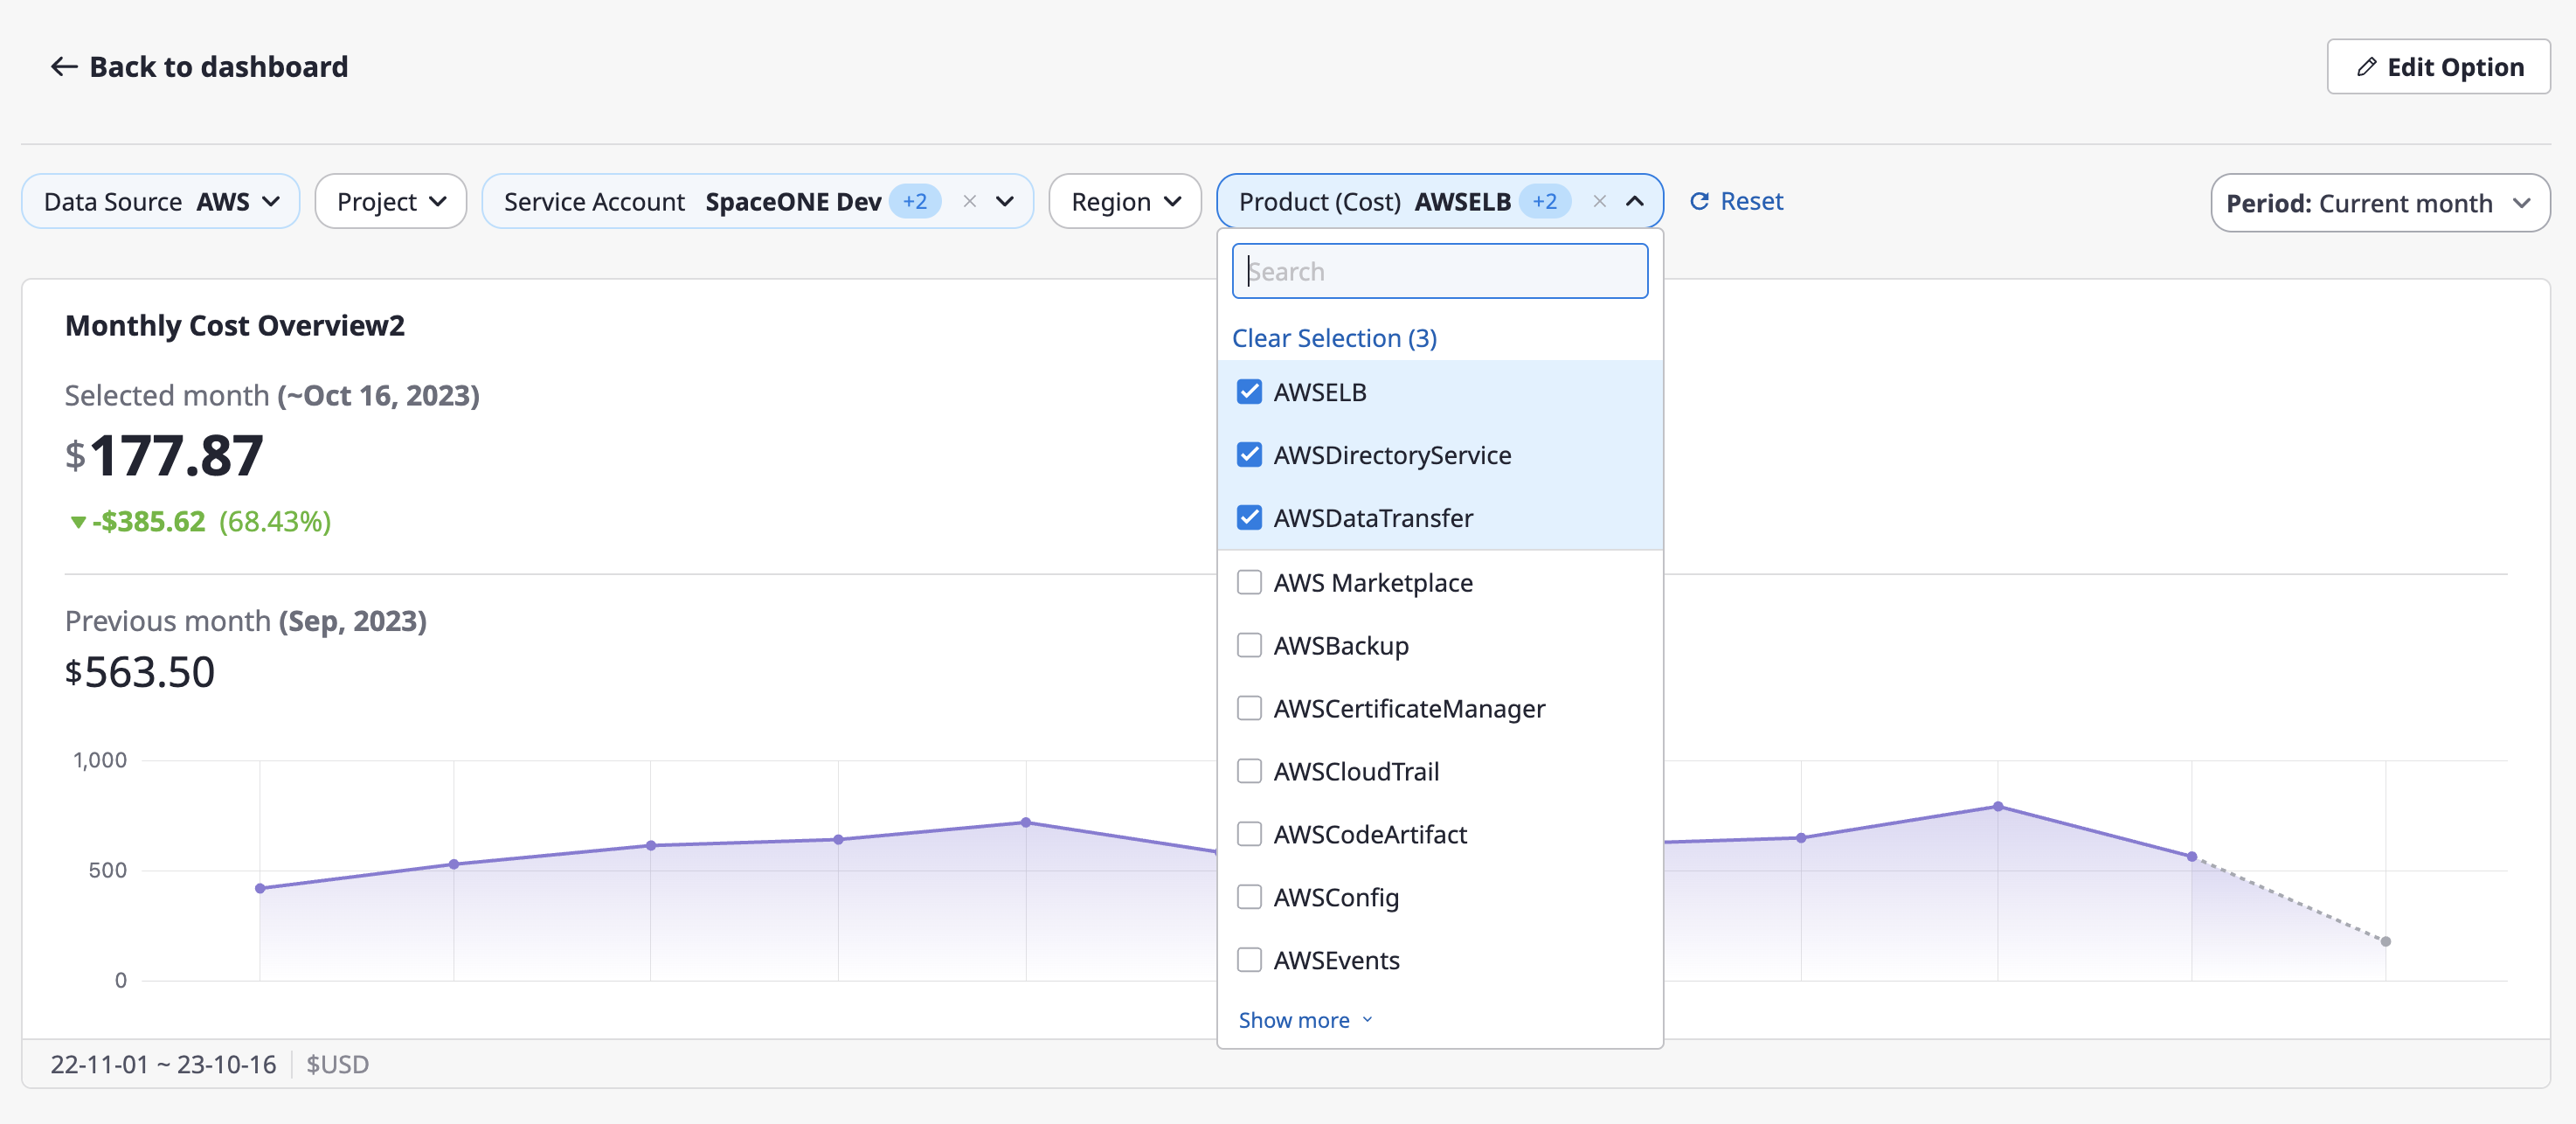
(3) If detailed editing of the widget is required, click the [Edit Options] button in the top-right corner.

(4) Similar to [Customize] mode, you can edit and save the specific items of the widget.
- For information on widget option settings, please refer to here.
